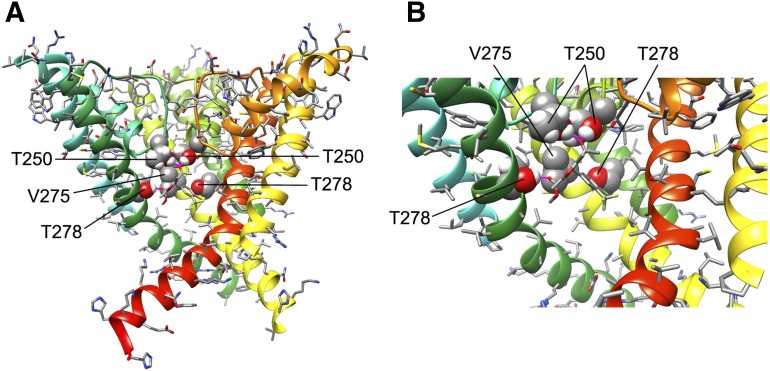
Fig. 9.
(R)-4-Phenyl-pyran interaction with KCa3.1 channel pore. (A) Transmembrane view of the ribbon representation of one of the lowest-energy models of the KCa3.1 channel complex with (R)-4-phenyl-pyran (shown in stick representation). Only three subunits are shown for clarity and each subunit is colored individually. Side chains of T250, V275, and T278 are shown in space-filling representation and labeled. Hydrogen bonds are shown in pink. (B) Close-up view of the model shown in (A).

