Fig. 3.

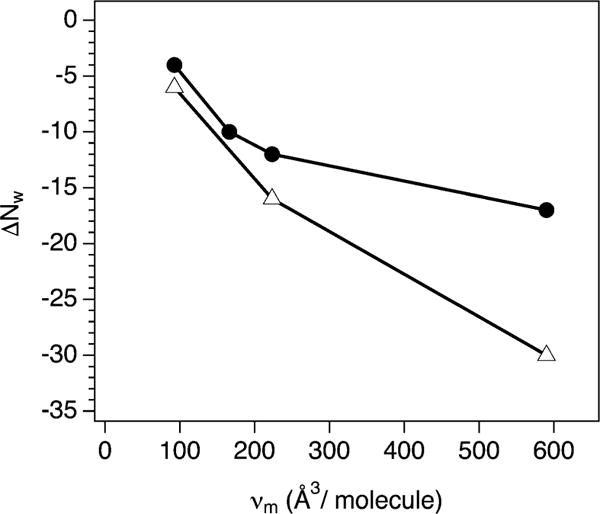
Net hydration change, ΔNw, accompanying the osmotic folding of NCBD (open triangles) and ACTR (filled circles) vs. molecular volume, vm, of each osmolyte used (smallest to largest: EG, xylitol, TEG, and PEG 400).

Net hydration change, ΔNw, accompanying the osmotic folding of NCBD (open triangles) and ACTR (filled circles) vs. molecular volume, vm, of each osmolyte used (smallest to largest: EG, xylitol, TEG, and PEG 400).