Figure 7.
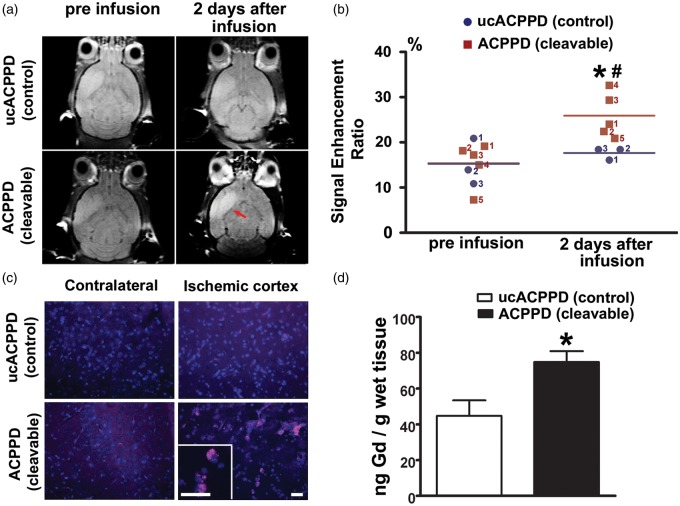
In vivo detection of gelatinase proteolysis with ACPPD, and quantification of Gd uptake by ICP-MS in mouse brain after MCA occlusion. (a) In vivo T1-weighted MRI before and two days after administration of ACPPD or ucACPPD (each containing 30 Gd-DOTA per dendrimer). Infusions were performed i.v. two days after ischemia with equivalent doses of approximately 300 nmol Gd (calculated as 400 nmol/kg × ∼30 Gd/dendrimer per 25 g mouse). Two days later, there was an increase in signal intensity contrast in the ischemic region (red arrow) of ACPPD-treated mice (mouse red#4 shown in panel (b)) compared to ucACPPD (mouse blue#1 shown in panel (b)). (b) Comparison of the signal enhancement ratio (SER) from the signal intensity (SI) measured by T1 MRIs among the various groups. Before infusion, the SER was not significantly different between the ACPPD and ucACPPD groups (p = 0.48). Within two days of infusion, the SER was significantly greater for ACPPD (*p = 0.0046), but not for ucACPPD (p = 0.24), compared to that of pre-infusion. Moreover, the SER was significantly greater for ACPPD than ucACPPD two days after infusion (#p = 0.0169 by one-tailed Student’s t-test, n = 5 in the ACPPD group; n = 3 in the ucACPPD; scattergram plots represent each mouse). (c) Ex vivo fluorescence imaging showing uptake of ACPPD in ischemic cortex compared to the contralateral side. There was virtually no uptake of ucACPPD in the ischemic cortex. Scale bars, 30 µm. (d) Quantification of ACPPD uptake in mouse brain after MCA occlusion. After MRI, mice were sacrificed and brain tissue separated into right and left hemispheres. Gd content of each sample was measured using ICP-MS and presented as the difference in ng Gd/g wet tissue between ischemic and contralateral hemispheres, which was significantly greater for ACPPD than ucACPPD (*p = 0.0134 by one-tailed Student’s t-test, n = 5 for ACPPD; n = 3 for ucACPPD). Data are expressed as mean ± SEM.

