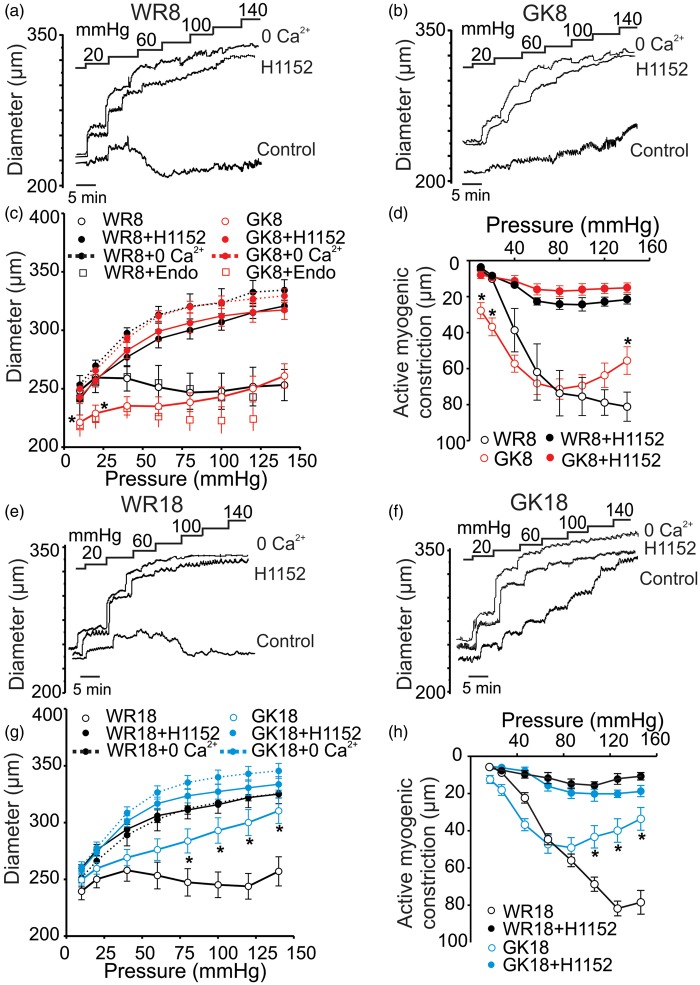
Figure 1.
Effect of ROK inhibition on the myogenic response of CAs from GK and WR. Panels (a), (b), and (c): Representative recordings (a) and (b) and mean values ± SEM (c) of CA diameter in response to step increases in pressure between 10 and 140 mmHg in control conditions (2.5 mmol/L Ca2+), in ROK inhibitor (H1152; 0.5 μmol/L), and in zero external Ca2+ (Ca2+-free) for 8–10 week WR (WR8, panel (a) and black lines in panel (c)) and GK (GK8, panel (b) and red lines in panel (c)) rats (n = 8 each). Open squares show mean diameter ± SEM of endothelium-intact CAs from 8-10 week WR (black) and GK rats (red) (n = 5 and 8, respectively). *Significantly different (P < 0.05) from corresponding value in WR8. Panel (d): Mean active constriction versus pressure ± SEM between 10 and 140 mmHg of CAs from WR8 (black lines) to GK8 (red lines) rats in control conditions (open symbols) and in the presence of H1152 (0.5 μmol/L; closed symbols) (n = 8).* Significantly different (P < 0.05) from value in WR8. Panels (e), (f), and (g): Representative traces (e and f) and mean values ± SEM (g) of CA diameter in response to step increases in pressure between 10 and 140 mmHg in control conditions (2.5 mmol/L Ca2+), in ROK inhibitor (H1152; 0.5 μmol/L), and in zero external Ca2+ (Ca2+-free) for 18–20 week WR (WR18, panel (e) and black lines in panel (g)) and GK rats (GK18, panel (f) and blue lines in panel (g)) (n = 8). Significantly different (P < 0.05) from corresponding value in WR18. Panel (h): Mean active constriction versus pressure ± SEM between 10 and 140 mmHg of CAs from WR18 (black lines) and GK18 (blue lines) rats in control conditions and in the presence of H1152 (0.5 μmol/L) (n = 8).* Significantly different (P < 0.05) from value in WR18.

