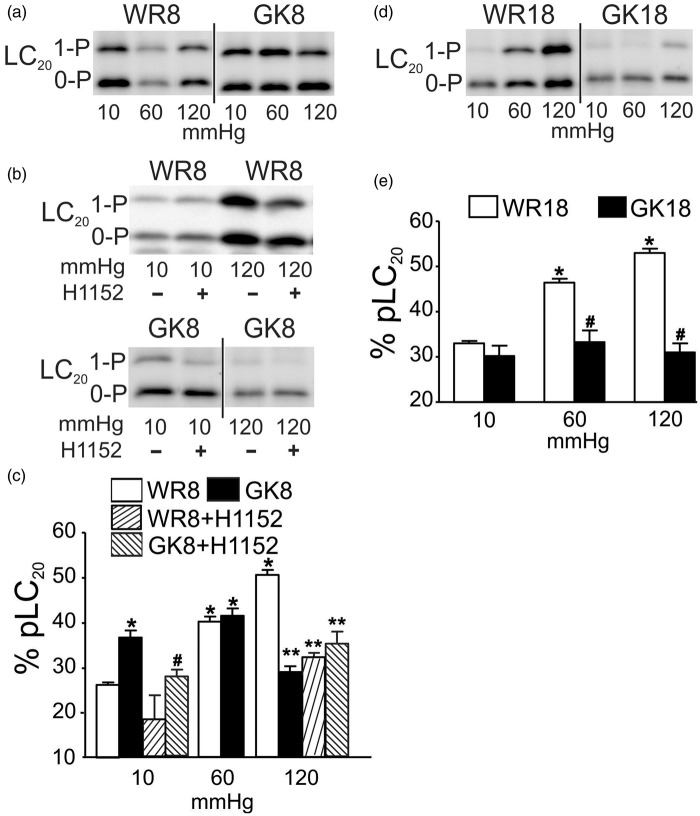
Figure 2.
Effect of ROK inhibition on pressure-evoked LC20 phosphorylation in CAs of GK and age-matched WR. Panels (a) and (b): Representative western blot for CAs of 8–10 week WR (WR8) and GK (GK8) rats at 10, 60, 120 mmHg (a), and for WR8 and GK8 vessels at 10 and 120 mmHg ± ROK inhibitor H1152 (0.5 μmol/L) (b). Monophosphorylated and unphosphorylated LC20 were separated by Phos-tag™ SDS-PAGE: upper band is monophosphorylated LC20 (1-P) and the lower band is unphosphorylated protein (0-P). Panel (c): Mean values ± SEM of LC20 phosphorylation as % of total LC20 at 10, 60, and 120 mmHg for CAs of WR8 (white bars) and GK8 (black bars) (n = 7), and at 10 and 120 mmHg for WR8 + H1152 (rising hatched bars) and GK8 + H1152 (falling hatched bars) (n = 3 and 7, respectively). * and # indicate significant difference (P < 0.05) from WR8 GK8 values at 10 mmHg, respectively. ** indicates significant difference (P < 0.05) from WR8 at 120 mmHg. Panels (d) and (e): Representative western blot (d) and mean values ± SEM (e) of LC20 phosphoprotein as % of total LC20 at 10, 60, 120 mmHg for CAs of 18–20 week WR (WR18, white bars) and GK rats (GK18, black bars) (n = 8). * and # indicate significantly different (P < 0.05) from WR18 value at 10 mmHg and WR18 value at the identical pressure, respectively. Note: All densitometric comparisons here and in subsequent figures were performed using single western blots; blots subsequently cut to remove lanes containing data not pertinent to the figure is denoted by a vertical bar, as in panel (a) between the WR8 and GK8 lanes.

