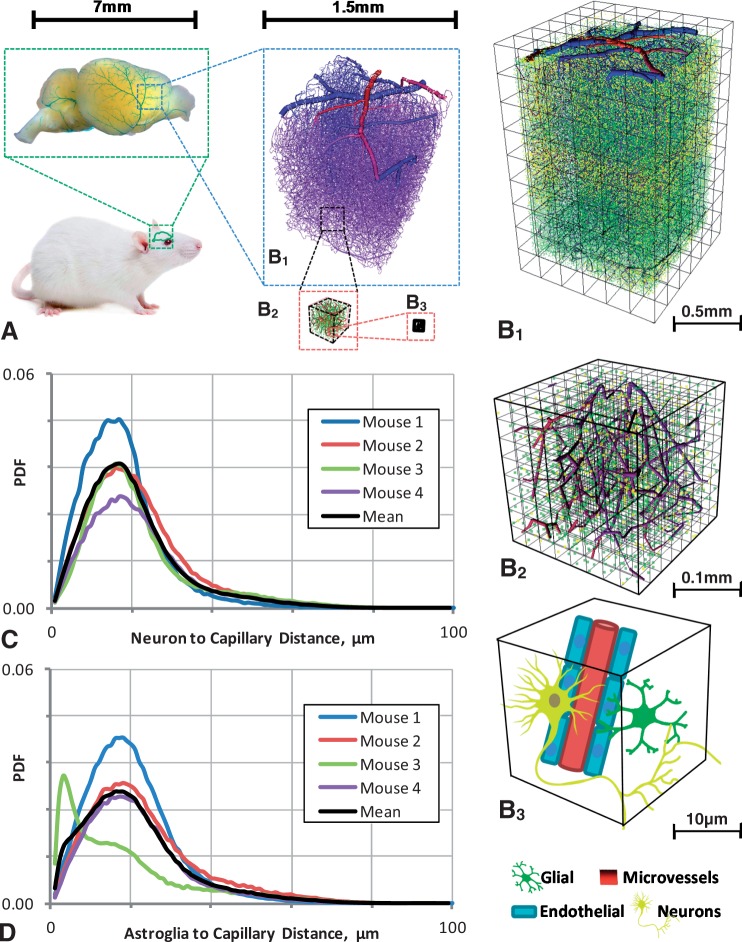
Figure 1.
Vectorized data of the multi-scale vascular and cellular morphology of the mouse cerebral cortex. (a) Illustration of the multi-scale resolution of the murine cerebral vasculature from the cortical surface vessels down to the cellular level. (whole brain snapshot taken from the NIH supported KOMP Phenotyping Pilot project73). (b) Full view of the microvascular network with cerebral arterioles in red, draining veins in blue, and capillaries in purple. Neuronal cells are displayed in yellow and glial cells in green at the 0.5 mm resolution. (Frames B1 to B3 show data in increasing magnification B1. 1.0 mm × 1.0 mm × 1.2 mm, B2. 200 µm × 200 µm × 200 µm, and B3. 25 µm × 25 µm × 25 µm. At the finest resolution in B3, cell bodies of neurons and glial cells were added for clarity). Histogram of cell to capillary distance for (c) neurons and (d) glial cells.

