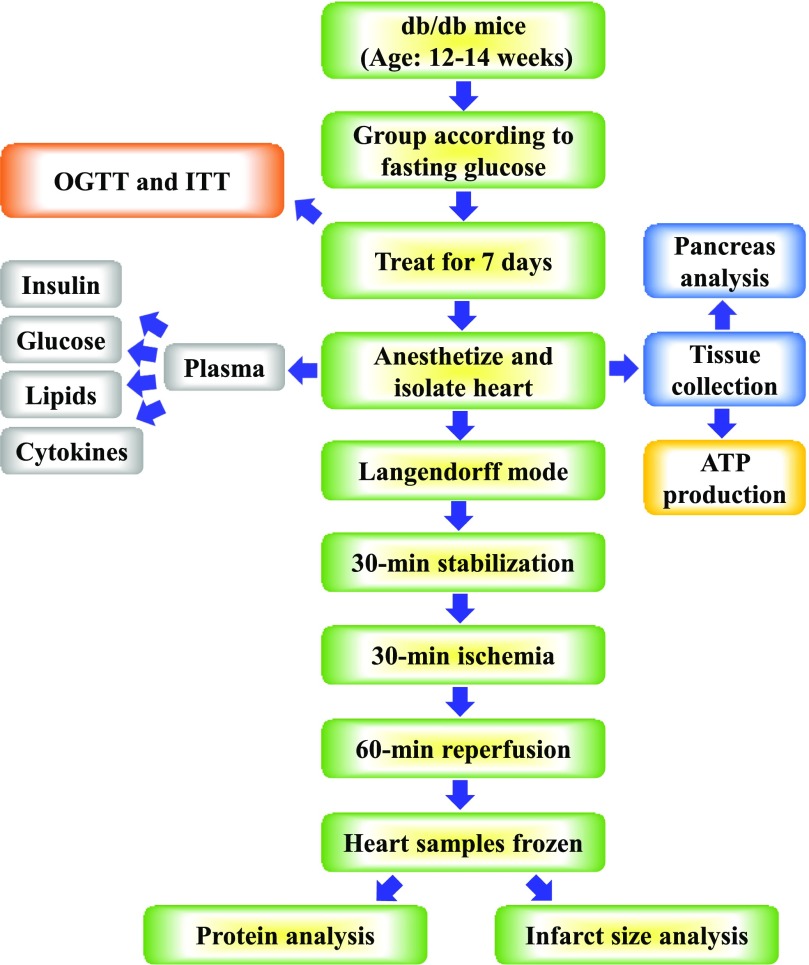
Fig. 1.
Experimental design and protocol. The schematic diagram shows the sequence and timing of various experimental procedures, including the drug treatment, OGTT, insulin tolerance test (ITT), harvest of tissue, global I/R in Langendorff mode, histology analysis, as well as plasma and cardiac tissue biochemical measurements.

