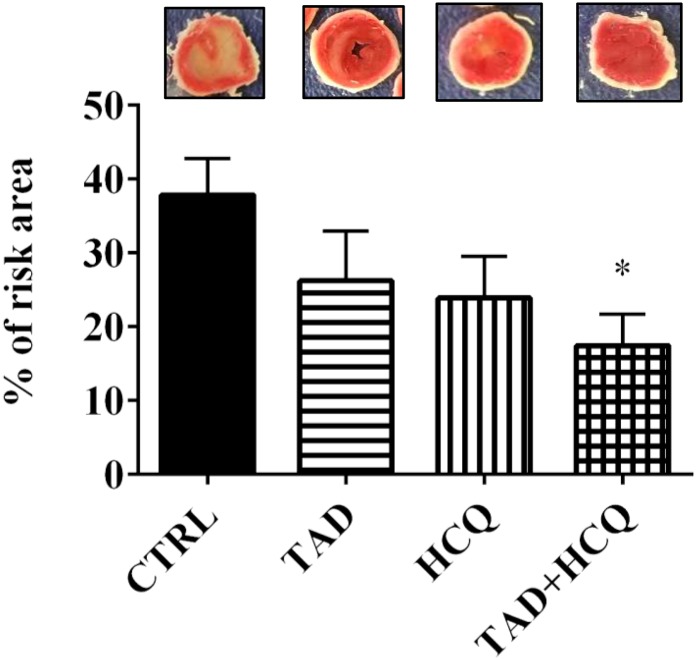
Fig. 2.
Effect of TAD, HCQ, and combination treatment on postischemic infarct size in db/db mice. Top: Representative images of transverse sections of TTC-stained hearts collected after 1-week respective drug treatments and ex vivo global I/R. Bottom: Bar diagram showing myocardial infarct size presented as % of risk area (mean ± S.E.M., n = 6 for CTRL and n = 5 for TAD, HCQ, and TAD + HCQ). *P < 0.05 versus CTRL group.

