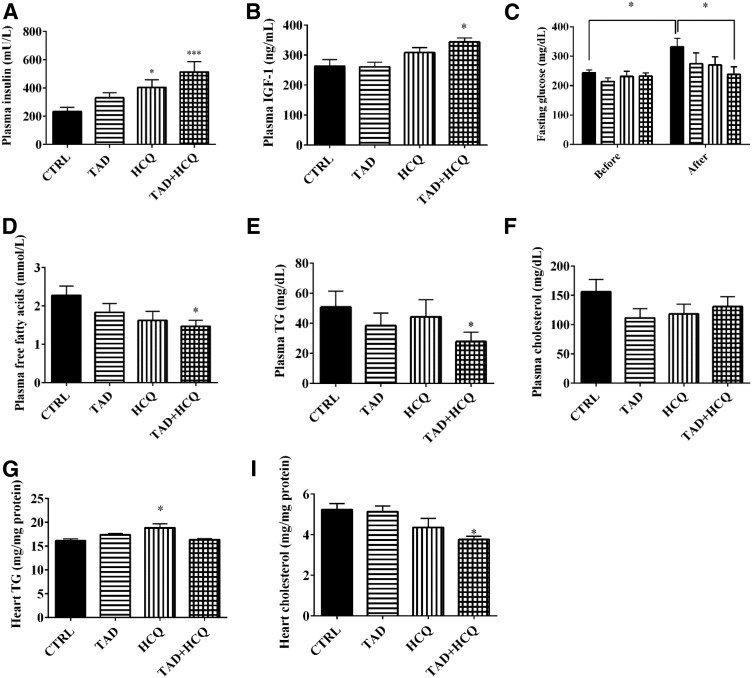
Fig. 4.
Changes in blood glucose, plasma insulin, IGF-1 levels, and lipid profile after treatment with TAD and HCQ. (A, B) Plasma insulin and IGF-1 levels measured with ELISAs. (C) Blood glucose levels measured before and after the 1-week drug treatment, respectively (mean ± S.E.M.; n = 13 for CTRL and HCQ, n = 15 for TAD, and n = 12 for TAD + HCQ). (D–H) Plasma and cardiac levels of free fatty acids, triglycerides, and total cholesterol measured using enzymatic assays (mean ± S.E.M., n = 8 for TAD, n = 9 for HCQ, and n = 12 for CTRL and TAD + HCQ). *P < 0.05; ***P < 0.001 versus CTRL group.

