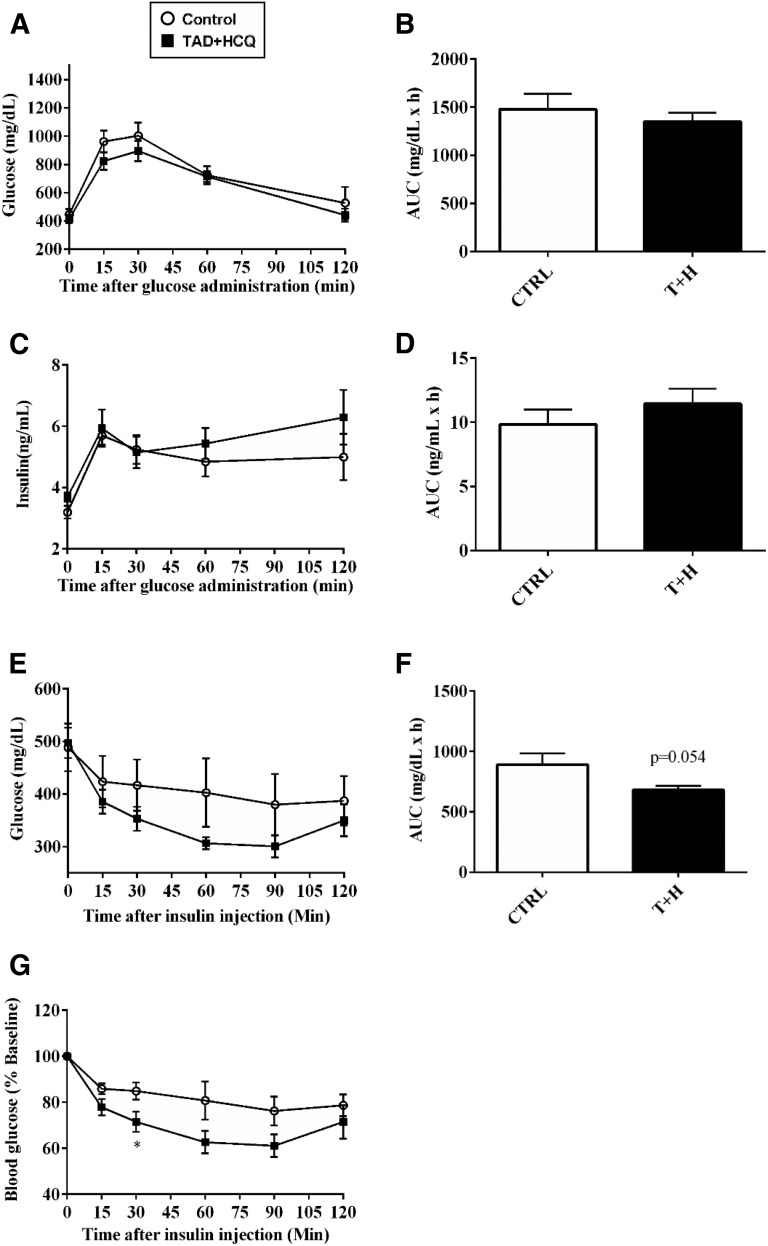
Fig. 5.
Insulin tolerance test (ITT) and OGTT after treatment with TAD, HCQ, and a combination of TAD + HCQ. Animals were fasted overnight before the OGTT. Glucose (2 mg/kg) was administered via oral gavage, and blood samples were taken from the tails. (A) Glucose levels; (B) area under the curve; (C) insulin levels; and (D) area under the curve. The ITT was performed after the animals were fasted for 6 hours. Insulin (0.9 IU/kg regular human) was given i.p.; (E) blood glucose levels; (F) area under the curve; (G) insulin response curve is presented as percentage to baseline glucose. Data are mean ± S.E.M. (n = 5/group,). *P < 0.05 versus CTRL group.

