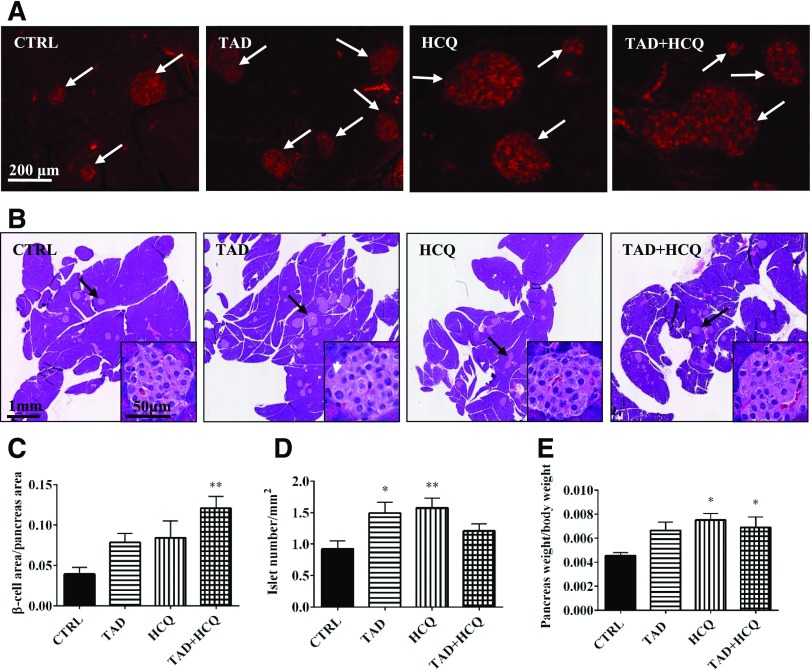
Fig. 6.
Effect of TAD, HCQ, or combination treatment on pancreatic islets. (A) Representative pictures of immunofluorescent-stained paraffin sections of pancreata. Goat anti-insulin antibody was used to detect insulin inside islets, and a secondary antibody conjugated with fluorescein isothiocyanate was used. (B) Representative pictures of H&E-stained pancreas, paraffin-fixed sections, with further magnified representative images of the pancreatic islets at lower-right corners. (C) Insulin-positive β-cell area versus pancreas area (n = 5/group). (D) Bar diagram showing pancreatic islet number per mm2 pancreas area in all treatment groups (n = 8 for TAD; n = 9 for CTRL, HCQ, and TAD + HCQ). (E) Bar diagram showing the percentage of pancreas mass versus body weight (n = 5/group). Data are mean ± S.E.M. *P < 0.05; **P < 0.01 versus CTRL.

