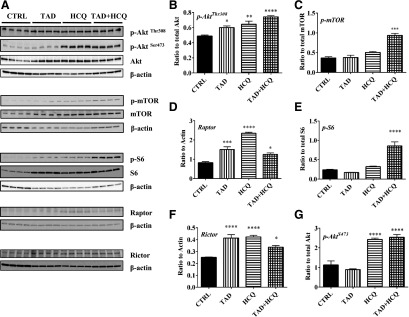
Fig. 7.
Effect of TAD, HCQ, or combination treatment on mTOR activation after I/R. (A) Representative Western blot images; (B) bar diagram showing quantitative analysis of cardiac p-AktThr308/Akt; (C) p-mTOR/mTOR; (D) expression of Raptor; (E) p-S6/S6; (F) Rictor; and (G) p-AktSer473/Akt after I/R. Data are presented as mean ± S.E.M. (n = 4/group). *P < 0.05; **P < 0.01; ***P < 0.001; ****P < 0.0001 versus CTRL group.

