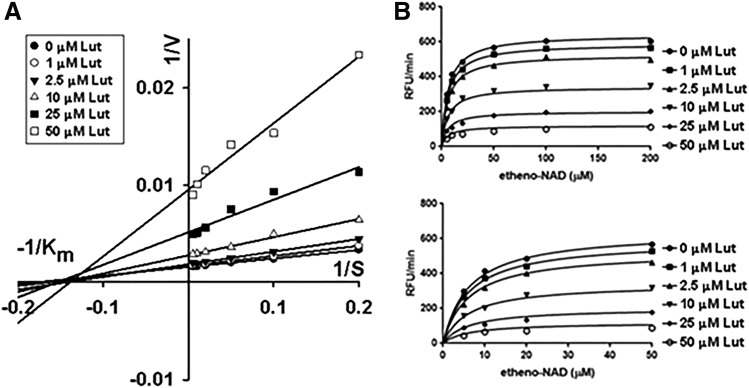
Fig. 3.
Luteolinidin as a CD38 inhibitor. (A) Lineweaver–Burk plot showing the effect of changing inhibitor concentration on 1/Vmax (y-intercept) and −1/Km (x-intercept) of rCD38 conversion of ε-NAD to ε-ADP-ribose. Luteolinidin decreased Vmax with an unchanging substrate Km for the reaction, consistent with noncompetitive enzyme inhibition. (B) Nonlinear regression using GraphPad software using a noncompetitive model. The top graph shows the full range of substrate concentrations (0–200 μM), whereas the bottom graph shows the 0–50 μM ε-NAD concentration range only. This model predicted a Ki of 11.4 μM (95% confidence interval). Each data point was the average of six to eight independent experiments.

