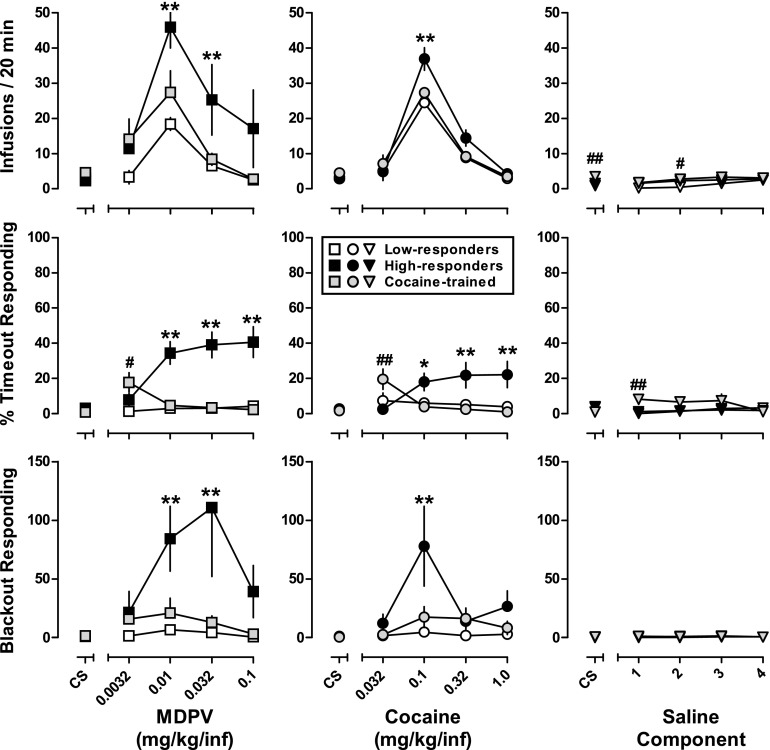
Fig. 3.
(Top row) Self-administration dose-response curves obtained under a multicomponent FR5 schedule of reinforcement for MDPV (left), cocaine (center), and saline (right) for high-responders (n = 8), low-responders (n = 8), and cocaine-trained (n = 16) rats. Ordinate: total infusions obtained during each 20-minute component. (Center row) MDPV-induced (left), cocaine-induced (center), and saline-induced (right) timeout responding. Ordinate: percentage of active lever responses made during postinfusion timeouts versus the active session during each 20-minute component. (Bottom row) MDPV-induced (left), cocaine-induced (center), and saline-induced (right) blackout responding. Ordinate: active lever responses made during each 5-minute intercomponent blackout period. Abscissa (for all panels): CS represents data following presentation of only the injection-paired stimuli, while numbers refer to dose of MDPV (left column) and dose of cocaine (center column) expressed as mg/kg/infusion on a log scale or saline component number (right column). Error bars represent ±S.E.M. Asterisks and pound signs indicate statistical significance: *P < 0.05 compared with cocaine-trained; **P < 0.05 compared with low-responders and cocaine-trained; #P < 0.05 compared with low-responders; ##P < 0.05 compared with low-responders and high-responders.

