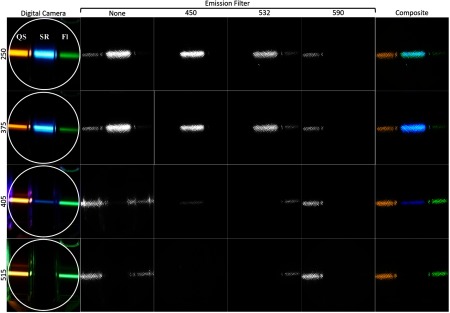
Fig. 6.
Images of fluorescence dyes in 1-cm wide cuvettes. From left to right the cuvettes contain sulforhodamine, quinine sulfate, and fluorescein. Each row of images corresponds to one of the four illumination wavelengths used. The left most column is an image taken with a digital camera. The white circle represents the approximate FOV of the endoscope. From left to right, the middle four columns are images taken with the endoscope with no, 450-, 532-, and 590-nm emission filters. The right-most column is the color composite image of the 450-, 532-, and 590-nm emission filter images.

