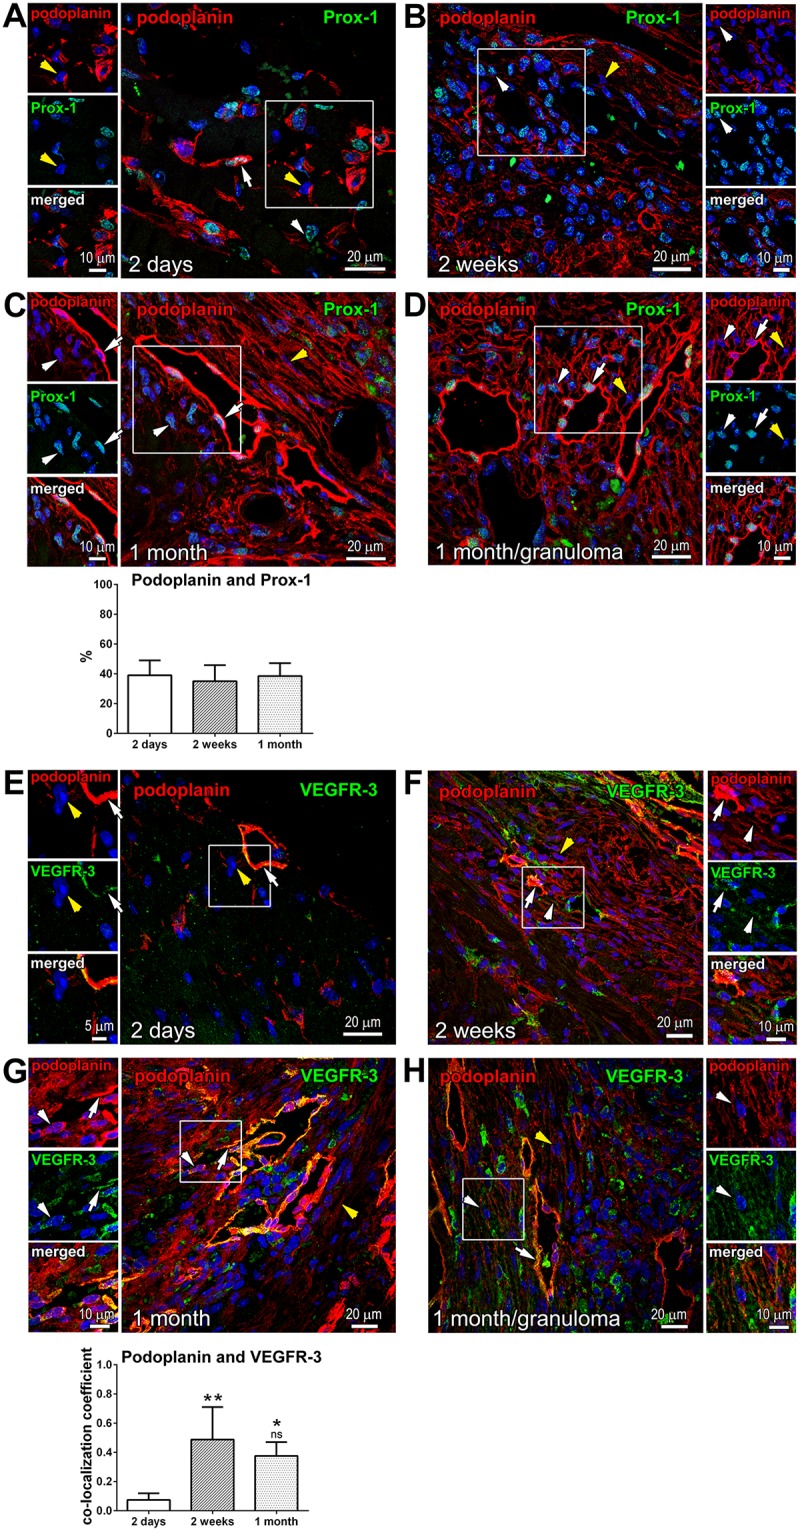
Fig 5. Variable expression of Prox-1 and VEGFR-3 in podoplanin-positive cells in the infarcted heart.

Thin cardiac sections were indirectly immunolabeled with antibodies that recognize podoplanin (red) and either Prox-1 (A-D; green) or VEGFR-3 (E-H; green). Nuclei, blue. Time after MI is indicated. Areas in rectangles are shown in the adjacent images for each color channel and merged. White arrows indicate examples of Prox-1 or VEGFR-3 labeling in the lymphatic endothelial cells of CLVs, and white arrowheads point to the examples of Prox-1 or VEGFR-3 staining in podoplanin-expressing interstitial cells. Yellow arrowheads exemplify instances of podoplanin-positive cells in which Prox-1 or VEGFR-3 expression was undetectable. Note the consistent detection of Prox-1 and VEGFR-3 in CLVs, and the heterogeneity in Prox-1 and VEGFR-3 labeling intensity in podoplanin-stained cells not organized into vessels. In C, quantitative image analysis (graph, lower panel) of the fraction of podoplanin-expressing cells co-labeled with Prox-1 is shown at indicated times after MI. Data represent mean and SD of the % double-positive cells out of all podoplanin-positive cells in the imaging field; n = 6–9 image fields per group. By one-way ANOVA, no significant changes between the groups. In G, quantitative image analysis (graph, lower panel) of the podoplanin co-labeling with VEGFR-3 is shown. Data represent mean and SD of the co-localization coefficient measured at indicated times after MI; n = 4–7 image fields per group. By one-way ANOVA, **P = 0.002 for 2 weeks vs. 2 days; *P = 0.009 for 1 month vs. 2 days; ns, not-significant for 1 month vs. 2 weeks.
