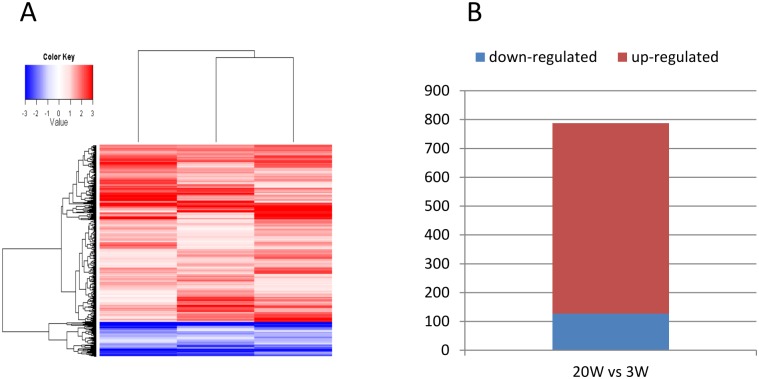
Fig 1. Vaccination induced qualitative differences at week 20 compared with week 3.
(A) Heat map of gene expression at 20 WPV compared with 3 WPV, shown as log2 (fold changes). Up-regulated and down-regulated genes are color-coded as red and blue, respectively. (B). Histogram of number of up- and down-regulated genes at 20 WPV compared with 3 WPV.

