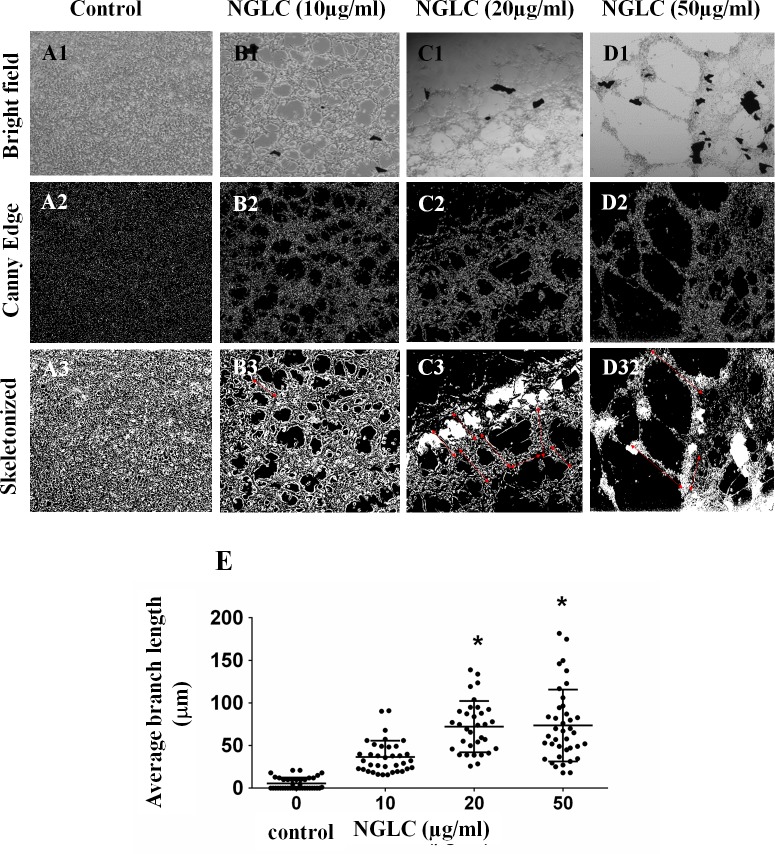
Fig 2. Influence of the concentration of nanocrystalline glass-like carbon (NGLC) microflakes on cell growth.
Changes in the cellular architecture in a monolayer SN4741 cells culture (A-D) after 7 days of culture with or without (control) NGLC microflakes at three different concentrations (10, 20 and 50 μg/ml). Control is shown in a monolayer culture with high confluence after 7 days (A1). An image analysis was performed using Image J/Fiji software and the pluging Canny Edge which inform about the outline structure (A2). A cellular architectural analysis was also done by using the plugin Skeletonized 2D/3D (A3). Brightfield of the same experiment at NGLC 10 μg/ml (B1) showing higher cellular network organization (B2) demonstrated by the skeletonized analysis (B3). Treatment with NGLC 20 μg/ml (C1) shows higher structural changes respect to the control (C2) producing greater networks (C3: see arrows). Cell culture with NGCL 50 μg/ml (D1) shows a cellular network with the greater branches among cell populations (D2) as it is indicated by the arrows (D3). Quantification of the branches length (E) was obtained by analysis of Skeletonized 2D/3D and Microscope Measurement Tools, ImageJ/Fiji software. Magnification = 5X. One-way ANOVA with Fisher’s post hoc test was used for comparison between different groups: *p<0.05 groups vs control.

