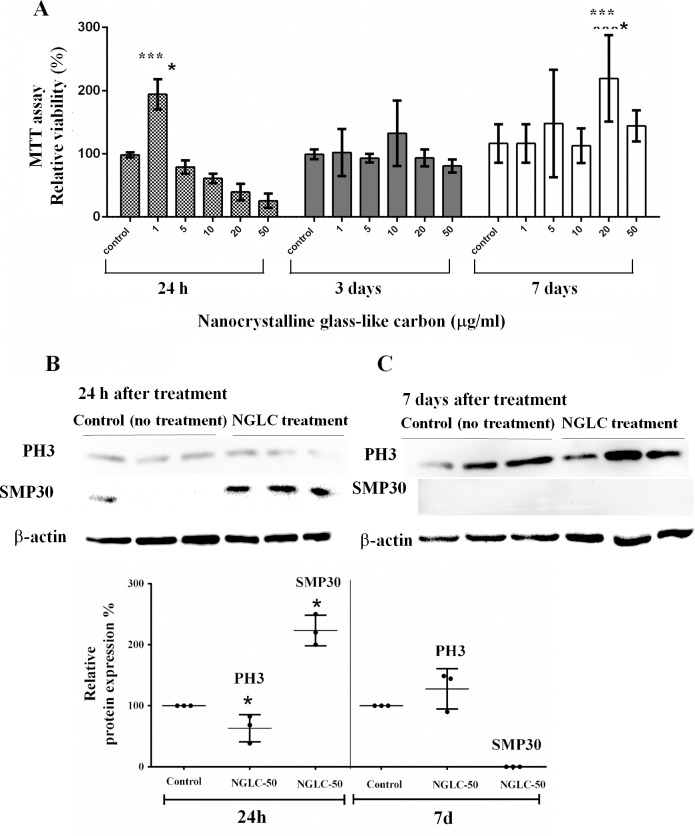
Fig 3. MTT assay for cell metabolism and proliferation.
SN4741 were cultured in media containing five different microflakes concentrations (0 as control, 1, 5, 10, 20 and 50 μg/ml) of nanocrystalline glass-like carbon (NGLC) for 24 h, 3 days and 7 days (A). Phosphorylate histone 3 (PH3) and SMP30 analysis by SDS-page western blot, shows the analysis at 24 h (B) and 7 days (C) using NGLC at 50 μg/ml vs control (without NGLC). Quantification of relative PH3 and SMP30 proteins expression (%) showing the normalized data with control sample at 24 hours and 7 days of culture (D). Data are expressed as mean±standard error of the means (SEM, n = 6). One-way ANOVA with Fisher’s post hoc test was used for comparison between different groups; ***p<0.001 groups vs control.

