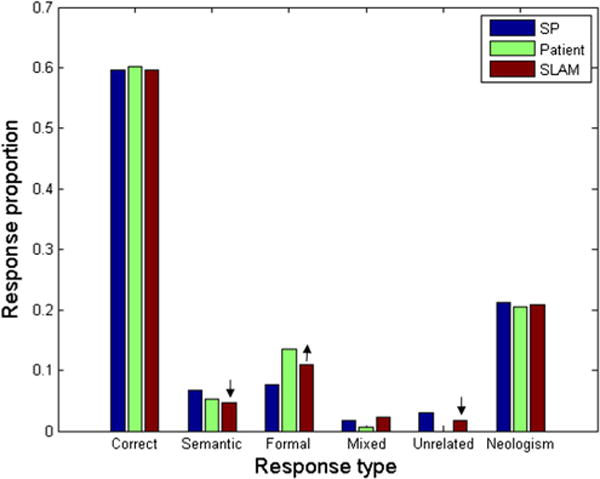
Fig. 8.

Naming response distribution from an example patient with conduction aphasia, along with the corresponding SP and SLAM model fits. Arrows indicate how SLAM improves the fit to data, by increasing formal at the expense of semantic and unrelated errors. The SLAM model reduced the fit error for this patient by .0135 RMSD
