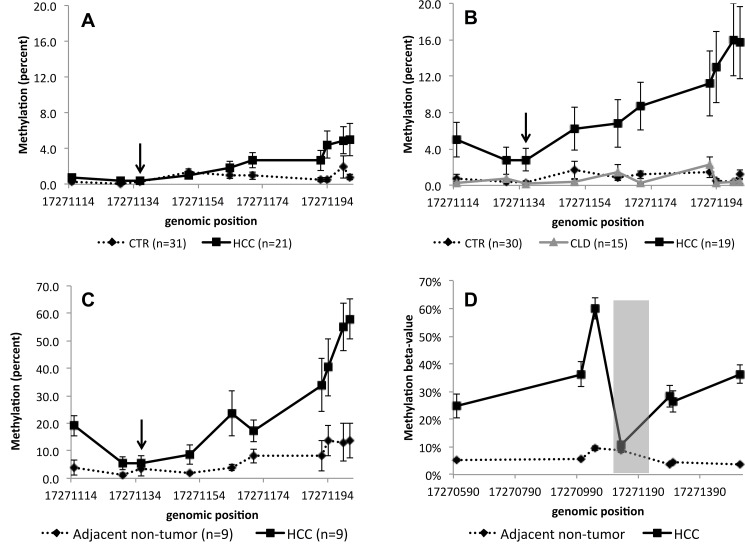
Fig 2. VIM methylation in cfDNA.
Cases from France (A) and Thailand (B), in tissue (C) (the arrows show the CpG-site analysed in TCGA data) and in TCGA data (D) (the grey area represents the area analyzed by massively parallel sequencing in this study). CTR: controls, HCC: hepatocellular carcinoma patients and CLD: chronic liver diseases. The error bars represent standard error of mean.

