Figure 1.
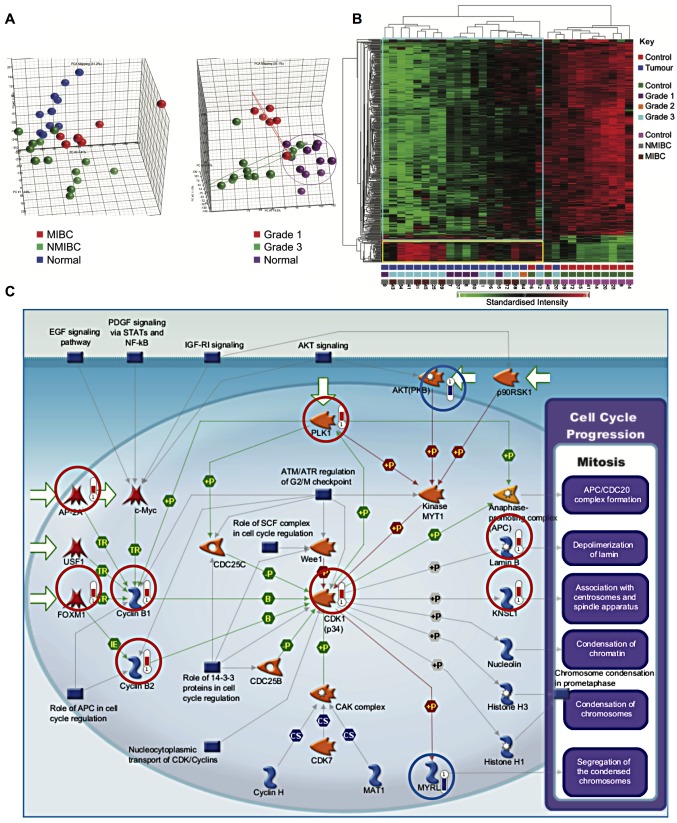
Cell proliferation genes are upregulated in bladder cancer. (A) Principal components analysis. Segregation into groups by tissue type and tumour grade was assessed. (B) Hierarchical clustering segregates tumour samples from healthy tissue. Key shown on the right. The numbers at the bottom of each column correspond to patient serial numbers. Standardised intensity range -2 (green) to 2 (red), 0 (black) fold change. (C) Genes involved in the initiation of mitosis are upregulated in bladder cancer (P=2.59×10⁻⁹). Genes circled in red and blue were, respectively, upregulated or downregulated in cancer samples. The length of the bar is proportional to the degree of change in expression.

