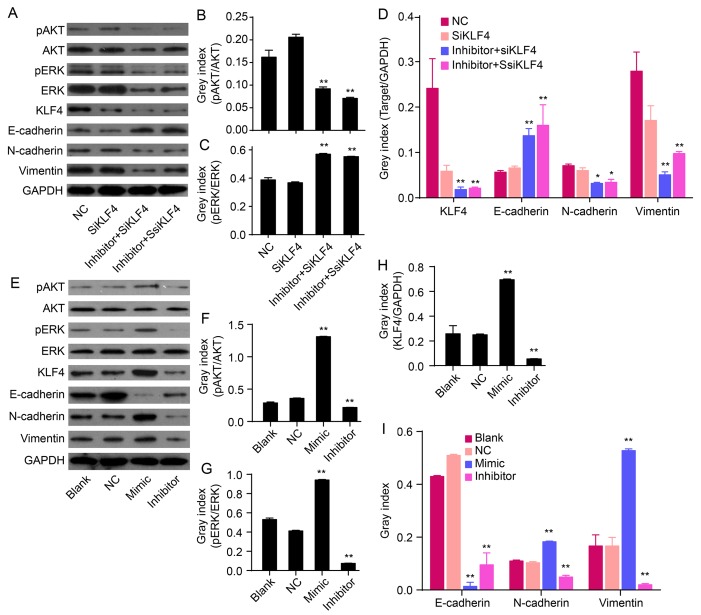
Figure 3.
Effects of miR-21 on the expression of KLF4, E-cadherin, N-cadherin, vimentin and/or Akt/ERK1/2 pathways. (A) The relative levels of p-Akt, Akt, p-ERK, ERK, KLF4 and EMT marker proteins were measured by western blot analysis. (B-D) Bands were semi-quantified using Quantity One software. (E) Western blot analysis showing protein levels of p-Akt, Akt, p-ERK1/2, ERK1/2, KLF4, mesenchymal markers (N-cadherin and vimentin) and epithelial cell marker (E-cadherin). (F-I) Bands were semi-quantified using Quantity One software. GAPDH was used as loading control (**P<0.01).

