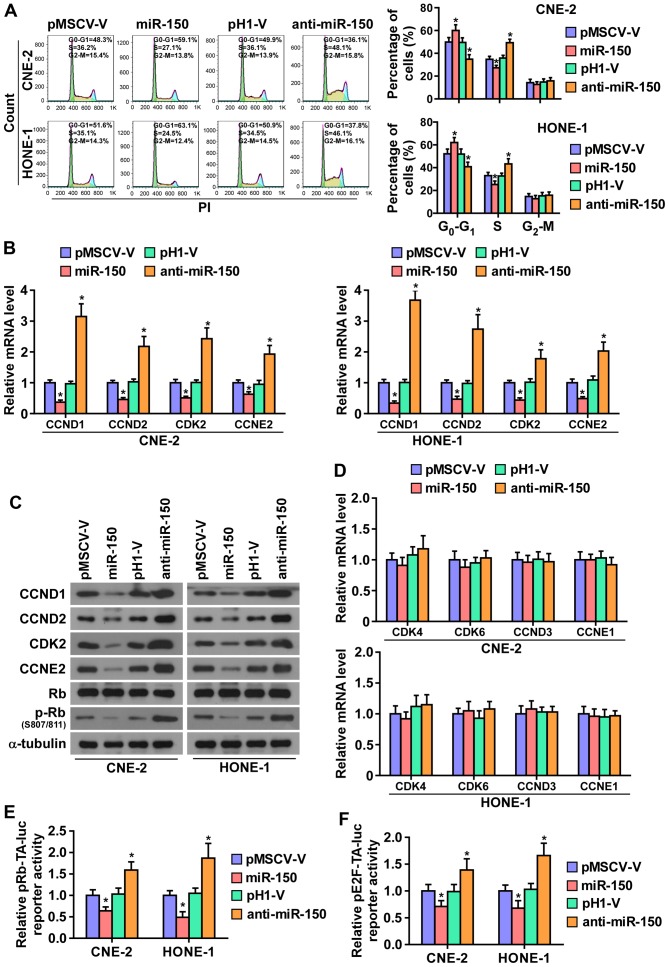
Figure 4.
miR-150 inhibits the cell cycle of nasopharyngeal carcinoma cells. (A) Flow cytometric analysis of the indicated nasopharyngeal carcinoma cells. Each bar represents the mean values ± SD of three independent experiments. *P<0.05. (B) Real-time PCR analysis of CCND1, CCND2, CKD2 and CCNE2 expression in the indicated cells. Transcript levels were normalized by GAPDH expression. Each bar represents the mean values ± SD of three independent experiments. *P<0.05. (C) Western blot analysis of CCND1, CCND2, CDK2, CCNE2 and p-Rb expression in the indicated cells. (D) Real-time PCR analysis of CDK4, CDK6, CCND3 and CCNE2 mRNA expression in overexpressed miR-150 and anti-miR-150 NPC cells, and their respective control vectors. U6 was used as the loading control. Each bar represents the mean values ± SD of three independent experiments. *P<0.05. (E and F) Relative Rb activity and E2F reporter activity in the indicated cells. Each bar represents the mean values ± SD of three independent experiments. *P<0.05.

