Figure 7.
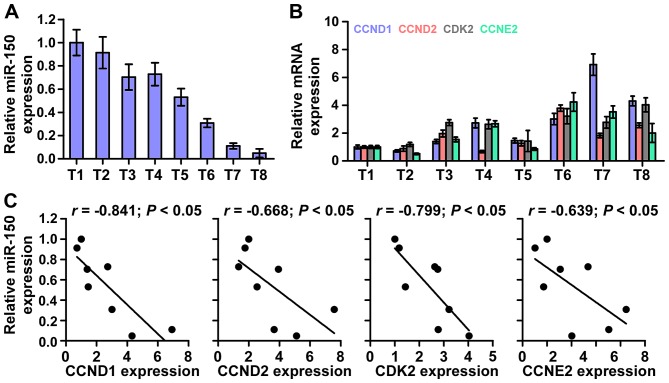
Clinical relevance of miR-150 with CCND1, CCND2, CDK2 and CCNE2 in nasopharyngeal carcinoma tissues. (A) miR-150 expression in eight freshly-frozen human nasopharyngeal carcinoma tissues. Transcript levels were normalized by U6 expression. One tissue sample was randomly selected and numbered as T1, other 7 tissue samples were numbered in order as T2, T3, T4, T5, T6, T7 and T8. The expression levels of miR-150 in each NPC tissue were normalized by the corresponding miR-150 expression in T1 NPC tissue. The relative expression levels of miR-150 after normalization were used to perform the correlation analysis among miR-150 and CCND1, CCND2, CKD2 and CCNE2 expression. (B) Analysis of CCND1, CCND2, CDK2 and CCNE2 expression in eight freshly-frozen human nasopharyngeal carcinoma tissues. Transcript levels were normalized by GAPDH expression. One tissue sample was randomly selected and numbered as T1, other 7 tissue samples were numbered in order as T2, T3, T4, T5, T6, T7 and T8. The expression levels of CCND1, CCND2, CKD2 and CCNE2 in each NPC tissue were normalized by the corresponding CCND1, CCND2, CKD2 and CCNE2 expression levels in T1 NPC tissue. The relative expression levels of CCND1, CCND2, CKD2 and CCNE2 after normalization were used to perform the correlation analysis among miR-150 and CCND1, CCND2, CKD2 and CCNE2 expression. (C) Correlation between miR-150 levels and CCND1, CCND2, CDK2 and CCNE2 expression in nasopharyngeal carcinoma tissues.

