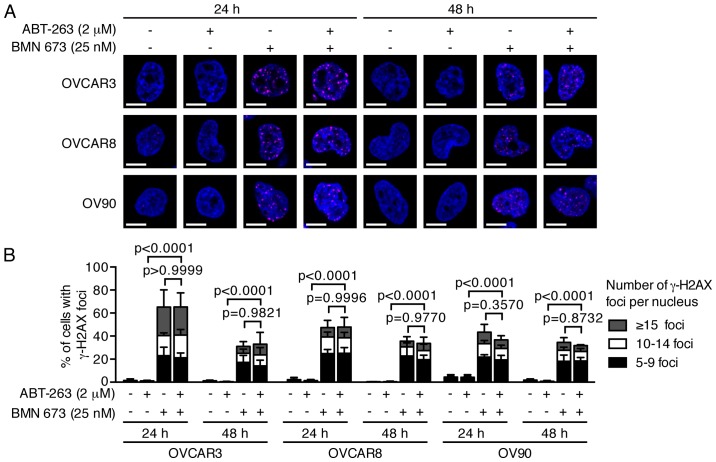
Figure 3.
Treatment effects on DNA damage. Three HGSOC cell lines were treated as described then assessed by staining for γ-H2AX and confocal immunofluorescence imaging. DMSO (0.002%) treatment was used as a vehicle control. (A) Representative images of at least four independent experiments are shown. γ-H2AX foci are colored in magenta, and nuclei are colored blue. Scale bar, 10 µm. (B) The percentage of γ-H2AX foci-positive cells (>5 γ-H2AX foci in nucleus) was determined by analyzing >120 cells per condition and shown as the mean ± SD of at least four independent experiments. P-values were calculated by a two-way ANOVA.

