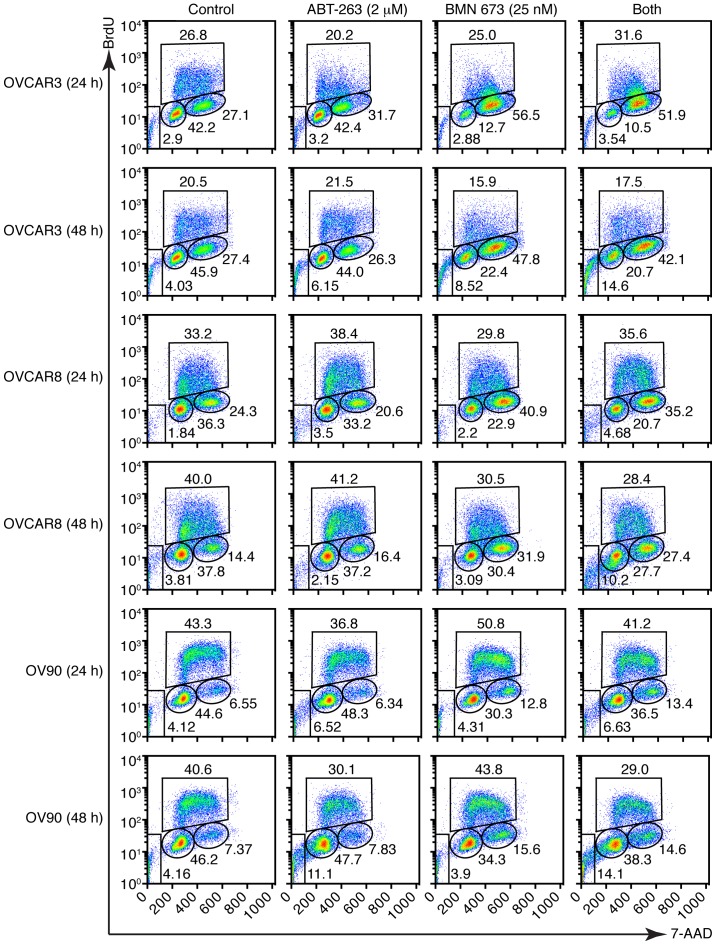
Figure 4.
Treatment effects on cell cycle distribution. Three HGSOC cell lines were treated as described then assessed by flow cytometric measurement of DNA content. DMSO (0.002%) treatment was used as a vehicle control. Representative pseudocolor dot plots of four independent experiments are shown.

