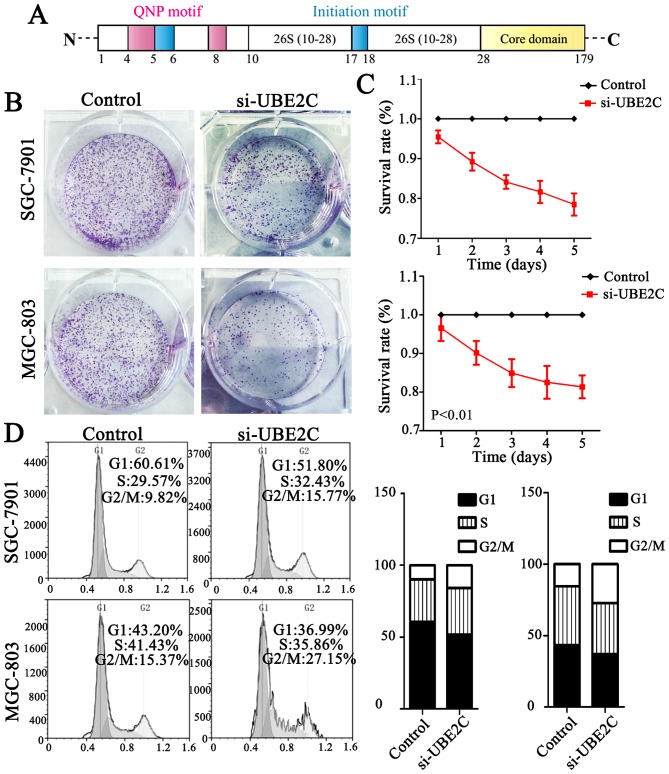
Figure 2.
UBE2C knockdown inhibits tumor formation and changes cell cycle distribution in MGC-803 and SGC-7901 cells. (A) The structure and motifs of UBE2C. Pink: QNP motif; red: initiation motif. (B) Colony formation assay for assessing the cell proliferation of si-UBE2C-treated cells. (C) Growth curves of MGC-803 and SGC-7901 cells before and after UBE2C gene knockdown. Data are expressed as the mean ± SD of at least three independent experiments, when compared to the control cell group (P<0.01). (D) Cell cycle distribution as a percentage of the total population. Data were obtained by flow cytometry and presented as the mean (n=3). Black bars represent the percentages of the fraction in G1, white bars represent the percentage of the fraction in G2/M, and the gray bars represent the percentage of fraction in S phase. UBE2C, ubiquitin-conjugating enzyme 2C.

