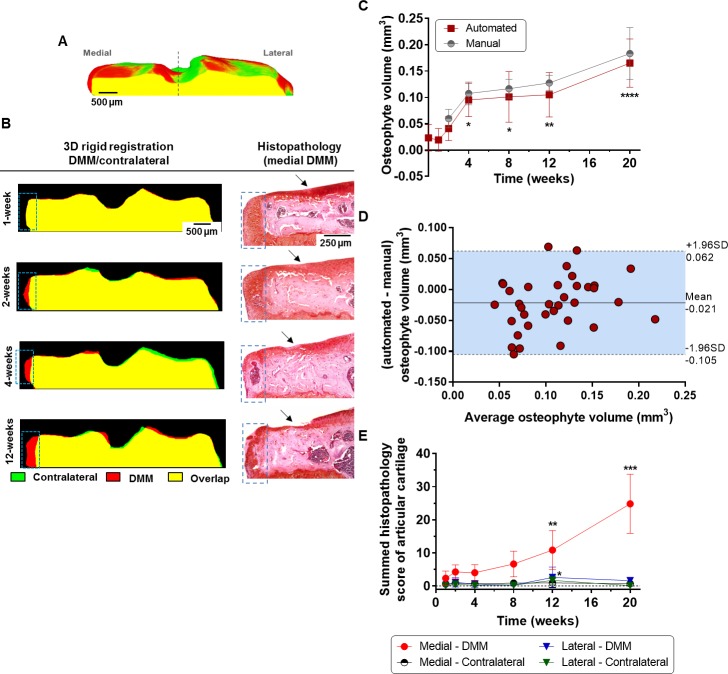
Fig 6. Osteophyte quantification using shape comparisons based on 3D image registration.
(A) Middle coronal view of a 3D model showing registration of DMM (colour-coded in red) to contralateral (colour-coded in green) tibia leading to superimposition between structures (colour-coded in yellow). The dashed line demarcates the medial and lateral aspects of the plateau. (B) Representative coronal views of registered DMM/contralateral tibiae showing osteophytes as a medial outgrowing protrusion (highlighted by dashed boxes), which were well validated by histopathology. Progressive articular cartilage damage is indicated by arrows. (C) Osteophyte volume measure either by automated or manual segmentation (n = 5, *P<0.05, **P<0.01 and ***P<0.001, computed by one-way ANOVA followed by multiple comparison tests using Bonferroni correction to determine differences between measurements in healthy baseline and subsequent time points post-surgery). (D) Bland-Altman plot to determine the agreement between the measurements in automatically and manually segmented osteophytes. The difference between measurements using automated and manual segmentation was plotted against the average (n = 35, with the measurements of all time points upon DMM pooled together). The mean (solid line) and the 95% limits of agreement (-1.96SD, +1.96SD, indicated by the area shaded in blue between the dashed lines) are reported in the plot. (E) Articular cartilage summed histopathology scores in medial and lateral aspects of the plateau for DMM and contralateral tibiae (n = 5, **P<0.01 and ***P<0.001 by non-parametric Kruskal-Wallis tests followed by post hoc Dunn’s multiple comparisons tests to determine statistical differences between scores at 1-week post-DMM and the subsequent time points for each aspect of the plateau).

