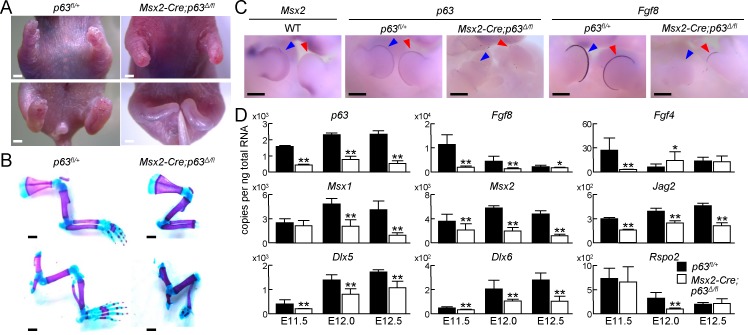
Fig 3. Impaired development of distal limbs in AER-specific p63 knockout mice.
(A) Gross appearances of upper extremities (top) and lower extremities (bottom) of p63fl/+ and Msx2-Cre;p63Δ/fl neonates. Scale bar, 1 mm. Images are representative of n = 3 mice per genotype. (B) Double staining with alizarin red and alcian blue of upper extremities (top) and lower extremities (bottom) of p63fl/+ and Msx2-Cre;p63Δ/fl neonates. Scale bar, 1 mm. Images are representative of n = 3 mice per genotype. (C) Whole-mount in situ hybridization (WISH) of Msx2 in a WT E11.5 embryo, and p63 and Fgf8 in p63fl/+ or Msx2-Cre;p63Δ/fl E11.5 embryos. Blue and red arrowheads indicate forelimb and hindlimb buds, respectively. Scale bar, 500 μm. Images are representative of n = 3 embryos per condition. (D) mRNA levels of p63 and AER-related genes in whole limbs obtained from p63fl/+ or Msx2-Cre;p63Δ/fl embryos at E11.5, E12.0 and E12.5. Error bars indicate s.d. (n = 3 biological replicates). *P < 0.05, **P < 0.01 vs. p63fl/+ (unpaired two-tailed Student's t test).

