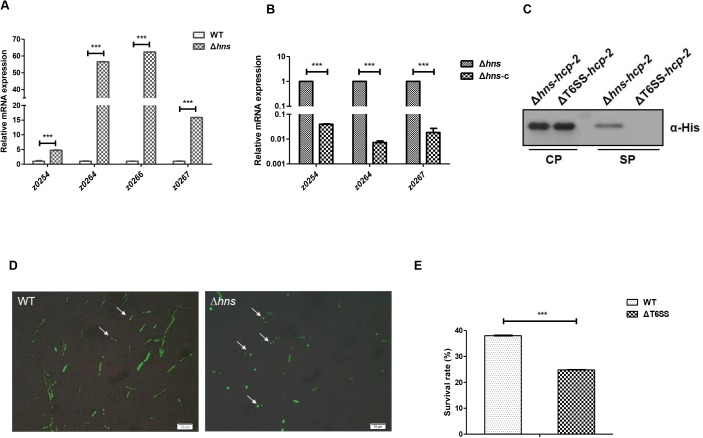
Fig 2. H-NS inhibits the expression of the T6SS genes of EHEC.
(A) Transcription of T6SS genes in the wild type EHEC (WT) and hns deletion mutant (Δhns). The WT and Δhns were cultured to an OD600 = 1.0 in LB broth at 37°C. Cultures were harvested, and total RNA was isolated. The relative expression levels of z0254, z0264, z0267 were analyzed by qPCR. 16S rRNA was used as the reference gene. Error bars represented SD from at least three independent experiments. ***, P<0.001, ANOVA analysis. (B) The transcription of T6SS genes in the hns deletion mutant and complementation strains. Δhns harboring either plasmid pACYC184 or pACYC184-hns were cultured to an OD600 = 1.0 in LB liquid at 37°C. Cultures were harvested followed by total RNA isolation. The relative expression levels of z0254, z0264(hcp-2) and z0267 were analyzed by qPCR. 16S rRNA was used as the reference gene. Error bars represented SD from at least three independent experiments. ***, P<0.001, ANOVA analysis. (C) The secretion of Hcp in EHEC. Δhns and ΔT6SS harboring pQE80YX1-z0264 with a His-tag sequence fusion at the C-terminus were cultured to an OD600 = 1.0 in LB broth at 37°C. The pellet and supernatant fractions of the cultures were analyzed by Western blot using anti-His tag antibody. Three biological repeats were performed. (D) Formation of discrete ClpV–GFP foci. The WT and ΔT6SS harboring pQE80-z0254-gfp were cultured to an OD600 = 1.0 in LB liquid at 37°C. Cells were collected and resuspended in 1× PBS to an OD600 = 10. The resuspended cells were mixed with E. coli strain MG1655 at the ratio of 10:1 and transferred to the agarose pad. After incubation in 37°C for 30 min, ClpV-GFP foci were observed by fluorescence microscopy. 100 cells were analyzed, and the final percentages were obtained from three independent experiments. (E) The intracellular survival of the WT and ΔT6SS in RAW264.7 macrophages. RAW264.7 cells were incubated with the WT or ΔT6SS at an MOI of 10 for 30 min and then chased in the presence of 100 μg/ml gentamicin for 2 h to kill extracellular bacteria. Cells were then incubated for 20 h in the presence of 25 μg/ml gentamicin. Lysates were then plated to count viable intracellular bacteria. Percent bacterial survival was calculated based on viable counts (CFU/ml) relative to that at 2.5 h post-infection. Error bars represented SD from at least three independent experiments. ***, P<0.001, Student’s t-test analysis.

