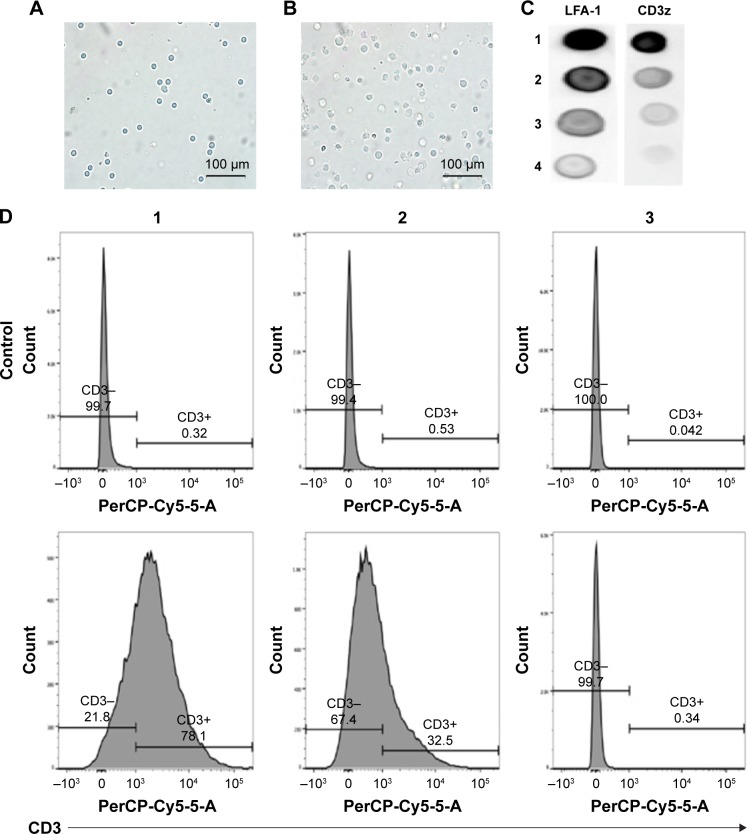
Figure 2.
Extraction and conformation of hCTL membranes.
Notes: Electron microscopy images of (A) hCTLs before processing into (B) hosts. (C) Immunoblotting for hCTL plasmacellular membrane marker proteins (LFA-1 and CD3z). Fractions 1 and 2 represent the lipid rings localized at the 40%–30% and the 55%–40% sucrose interface of the sucrose gradient, respectively; fraction 3 represents the pellet of the sucrose gradient; and fraction 4 represents the final pellet of the homogenization and centrifugation steps. (D) hCTL membranes were labeled using a fluorescent antibody against CD3 and analyzed using FACS using no threshold on the forward scatter to detect the nanoparticles. Fraction 1 represents hCTL membranes; fraction 2 represents hCTL membranes before the sucrose gradient purification; and fraction 3 represents red blood cell membranes as a negative control.
Abbreviations: hCTL, human cytotoxic T lymphocyte; LFA-1, lymphocyte function-associated antigen-1.

