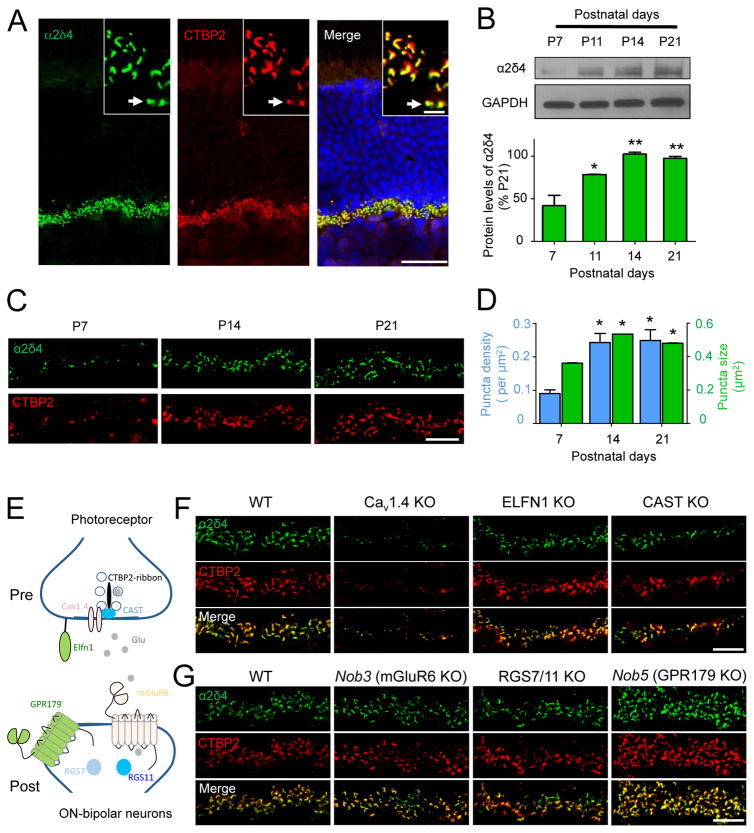
Figure 1. Relationship of α2δ4 to synapse development and key molecules at photoreceptor ribbon synapses.
A, Localization of α2δ4 at photoreceptor synapses. (scale bar, 25 μm). Insert shows the outer plexiform layer (OPL) at higher magnification (scale bar, 5μm). Arrow points to cone synapses. B, Quantification of changes in α2δ4 protein levels during synaptogenesis by Western blotting. Protein samples from different WT and KO retinas were loaded on the same gel alternately. Error bars are SEM values, *p<0.05, **p<0.01, n=3 mice, One-way ANOVA. C, Analysis of α2δ4 accumulation at ribbon synapses of photoreceptors in the OPL during development. D, Quantification of changes α2δ4 accumulation at synapses. The total number of puncta selected was 69, 195, and 202 for P7, P14, and P21, respectively. Images of two different sections of each retina and two retinas from different mice at each stage were used for analysis. Error bars are SEM values, *p<0.05, One-way ANOVA. E, Scheme illustrating identity and localization of key molecules at photoreceptor synapses. F, Effect of eliminating key pre-synaptic molecules on expression and localization of α2δ4 at the ribbon synapses. G, Effect of eliminating key post-synaptic molecules on expression and localization of α2δ4 at the ribbon synapses. In C, F, G, scale bar is 10μm; retinas used are from 1–4 month old mice.

