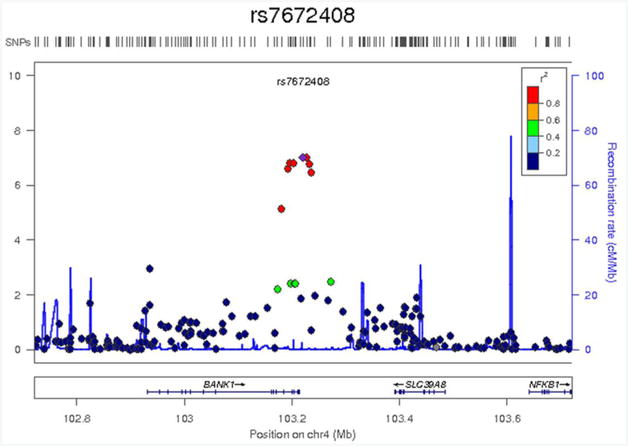
Figure 3.

Detailed view of the locus showing suggestive association (p = 9.9×10⁻⁸) with average BOLD percent signal change in the left supramarginal gyrus [0; 36; 34]. Genetic markers are represented as circles. Markers are placed at their position on chromosome 4 (x-axis) and graphed based on the −log10(p-values) of their association to the phenotype (y-axis). The level of linkage disequilibrium to the most associated SNP (rs7672408) is represented in colour using the CEU panel from HapMap Phase II. The location of genes is shown below the plots. Images were created using LocusZoom (http://csg.sph.umich.edu/locuszoom/).
