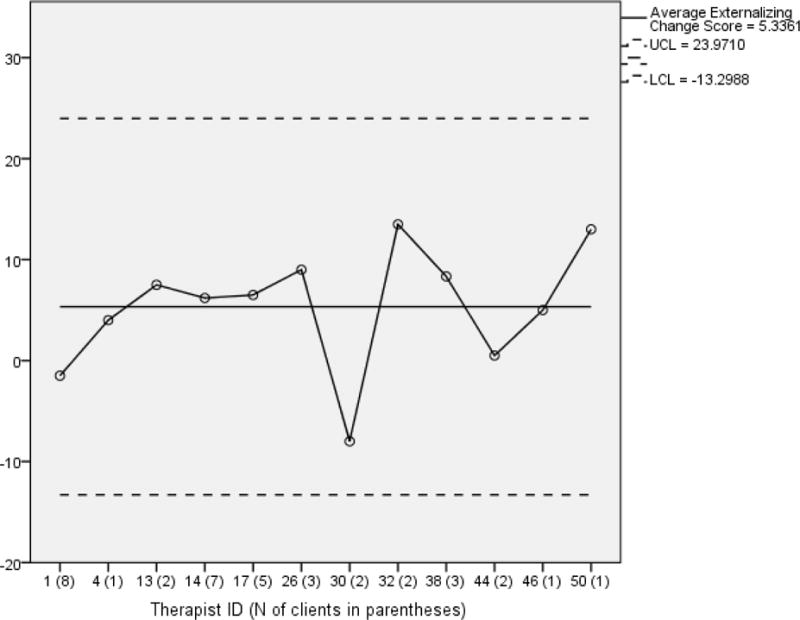
Figure 3.

SPC mean chart for change in Externalizing symptoms: Therapist variability in client outcomes.
Note. The numbers on the x-axis correspond to the Therapist identification code for each of the 12 therapists. Points on the chart are averages of Externalizing symptom change scores across clients for each therapist. UCL = Upper Control Limit for change in Externalizing symptoms derived from the data; LCL = Lower Control Limit for change in Externalizing symptoms derived from the data.
