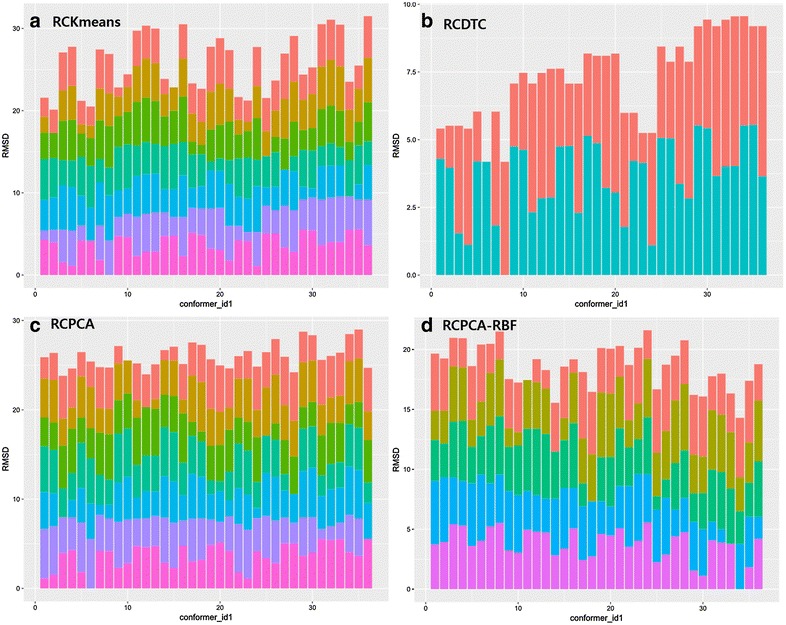
Fig. 6.

Histograms of the RMSD between four representative conformer ensembles and conformers of original set in the entry 41. a RCKmeans, b RCDCT, c RCPCA, and d RCPCA-RBF (x-axis: conformer ID in original set, y-axis: RMSD (Å), and different colors means each representative conformer ID chosen under the clustering)
