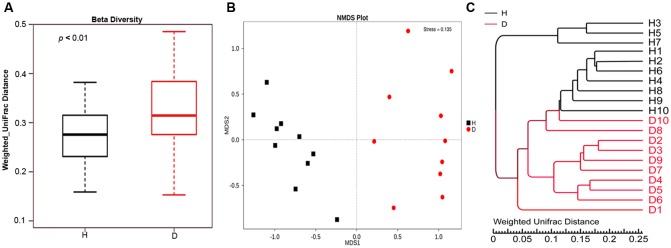
FIGURE 2.
Comparison of fecal microbial community structure between diarrheic and healthy piglets. (A) Beta diversity (Wilcoxon rank-sum test, p < 0.01), (B) NMDS plot (ANOSIM R = 0.8536, p = 0.001) and (C) UPGMA tree, all revealing significant differences between diarrheic and healthy piglets based on the weighted UniFrac distances of OTU community. The diarrheic sample and healthy sample is abbreviated as D and H, respectively.

