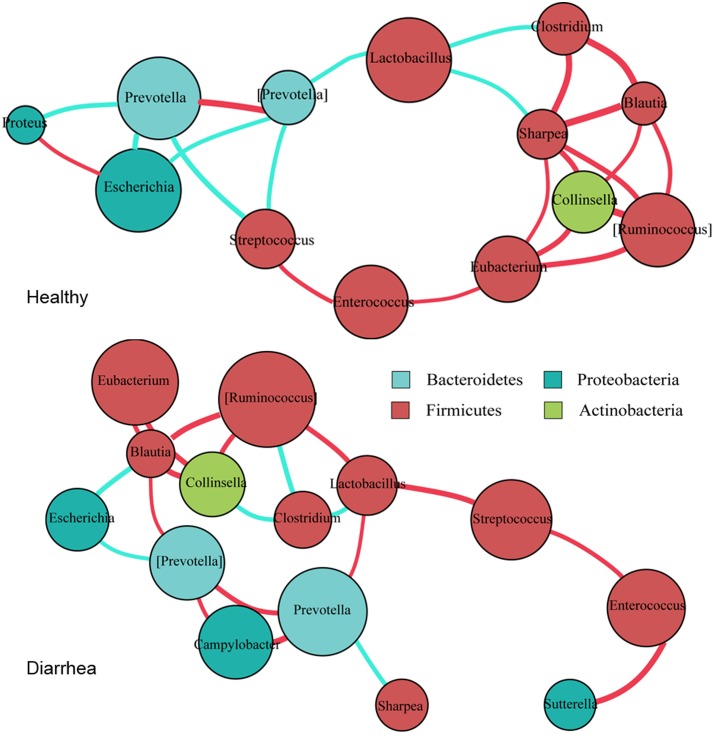
FIGURE 4.
Co-occurrence networks of bacterial genera constructed on the healthy and diarrheic piglets. Co-occurrence networks were deduced from 15 marker genera that were identified from 16S rRNA sequencing. Each node represents a genus, the size of each node is proportional to the relative abundance; the color of the nodes indicates their taxonomic assignment. Connection of paired nodes represent Spearman correlation coefficient (red) above 0.5 or below 0.5 (cyan), the thickness of each connection is proportional to the r-value.

