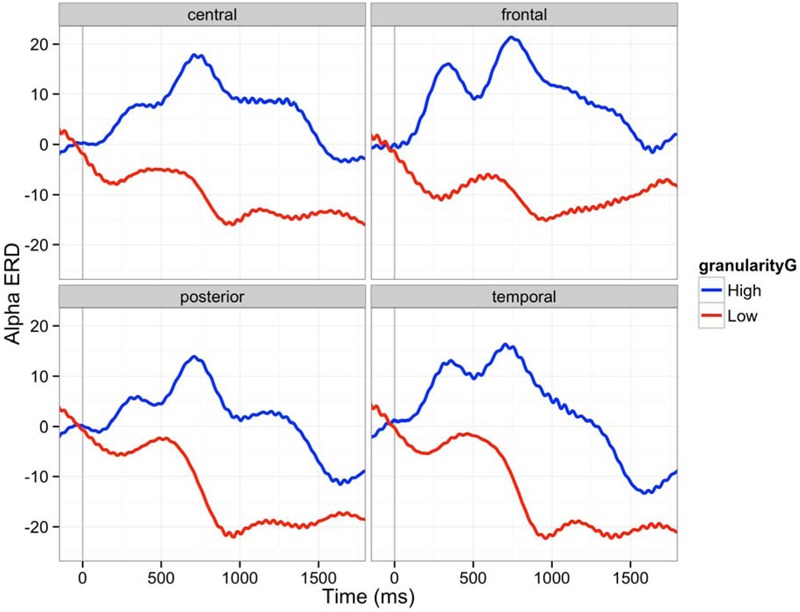
FIGURE 6.

Alpha ERD (8–12 Hz) in four brain regions (C: central, F: frontal, P: posterior, T: temporal): The 150 ms pre-stimulus period was used as the baseline. Red line is an average ERD of five participants whose granularity was above one sigma of average granularity. Blue line is an average ERD of four participants whose granularity was below one sigma of average granularity. The 150 ms pre-stimulus period was used as the baseline.
