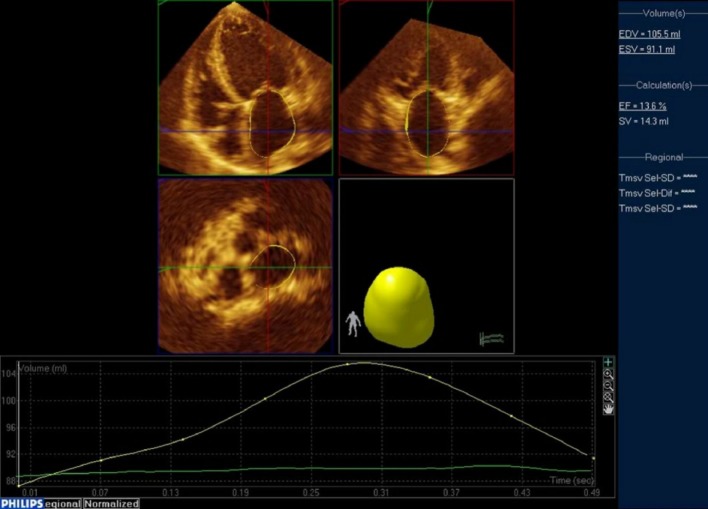
Figure 2.
Representative case of LA quantification using Philips QLab. From the full-volume datasets, 2 orthogonal long-axis and 1 short-axis views of the LA at end-diastole and end-systole were selected. The software automatically determined the LA wall in 3D space using the deformable shell model and made time domain LA volume curve, from which maximal and minimal LA volumes. Manual adjustment when inadequate tracking of the LA wall was observed. LA, left atrial.

