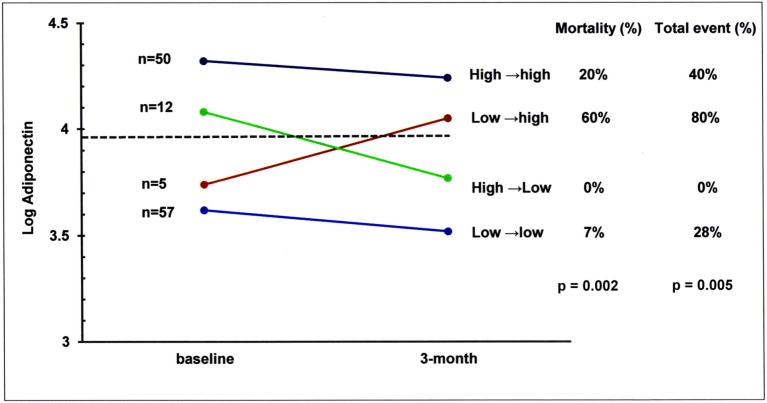
Figure 4.
Serum levels of adiponectin in the study patients grouped according to changes of adiponectin over time following treatment. The number of patients (left) and subsequent mortality and MACE rates (right) are presented for the four subgroups of adiponectin changes, from baseline to 3 months. MACE, major adverse cardiovascular events.

