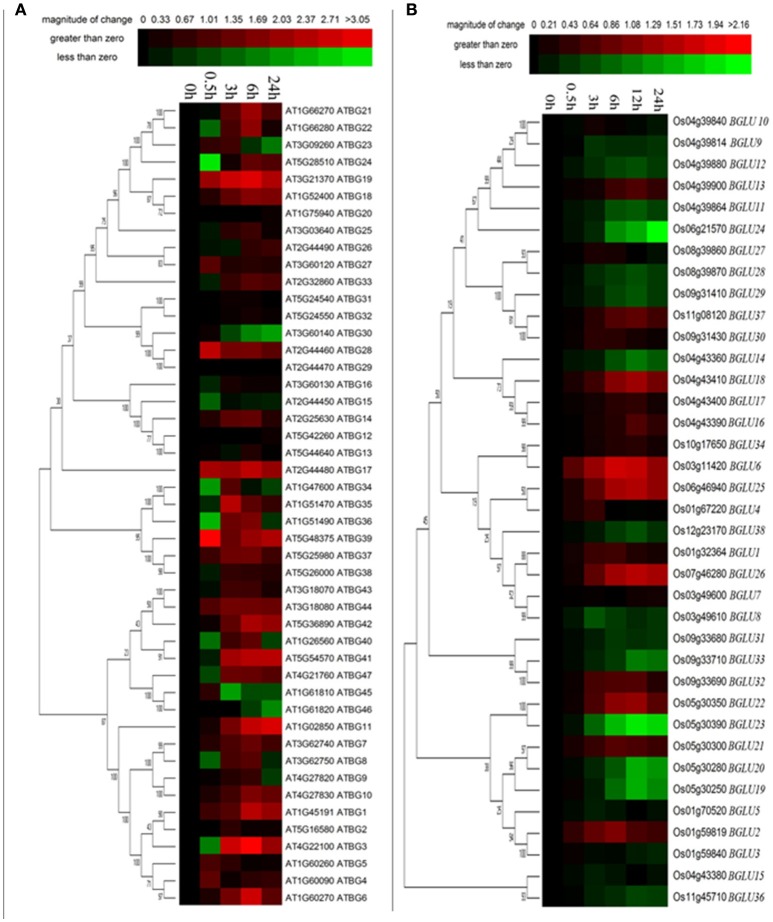
Figure 5.
Expression of Arabidopsis and rice BGLU genes under NaCl treatment. Hierarchical cluster analysis were used for the expression of Arabidopsis and rice BGLU genes after (A) 0.5, 3, 6, and 24 h or (B) 0.5, 3, 6, 12, and 24 h 150 mM NaCl treatment. The relative gene expression values (log2 scale of qRT-PCR, n = 3, technical replicates) were analyzed using the R language programmed heatmap format. Red and green colors represent the up-regulation or down-regulation of gene expression, respectively.

