Figure 6.
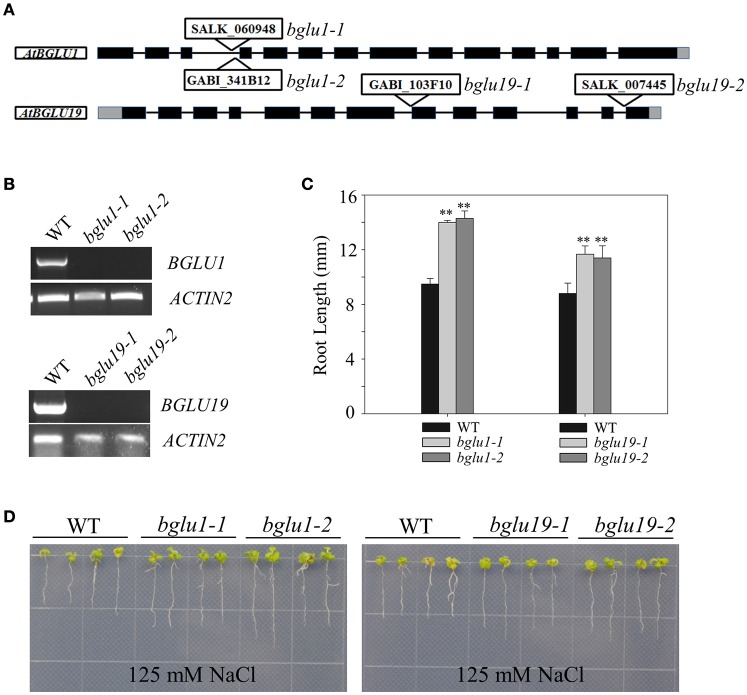
Phenotypic characterization of AtBGLU1 and AtBGLU19 under NaCl treatment. (A) Schematic view of T-DNA insertion for atbglu1 and atbglu19. Black and gray boxes are exons and 5′ or 3′-UTR regions, respectively. (B) Semi-quantitative reverse transcription polymerase chain reaction (RT-PCR) for identification of Arabidopsis knockout mutants. Plant RNA was extracted from rosette leaves of 4-wk-old WT, atbglu1, and atbglu19 plants. AtACTIN2 was used as control. (C) Relative primary root length amongst WT, atbglu1, and atbglu19 seedlings under NaCl treatment were shown. Values are means ±SE (n = 20; 20 seedlings per genotype were measured from 3 plates and the experiments were repeated twice). (D) WT, atbglu1, and atbglu19 plants seeds were germinated on MS medium for 4 days, and seedlings were subsequently transferred to MS supplemented with 125 mM NaCl for 10 days. Asterisks indicate significant differences compared with wild type by Student-T test (**P < 0.01).

