
Figure 7.
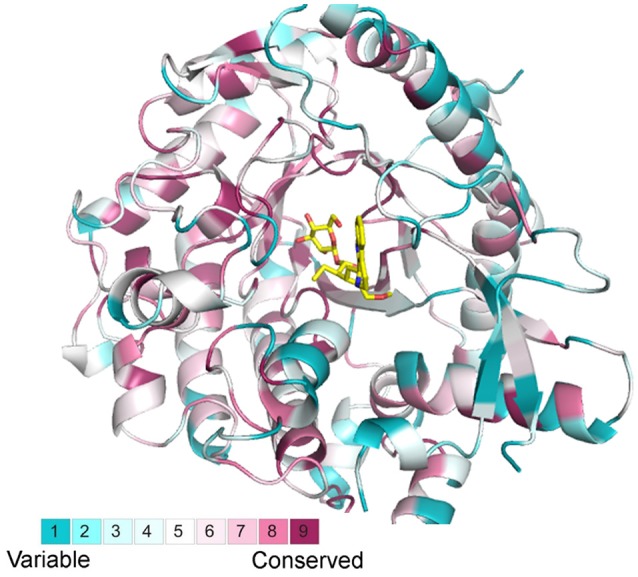
Structural alignments from selected BGLU homologs with the canonical BGLU structure. Ribbon representations of the BGLU structure are colored according to conservation in 304 selected BGLU sequences from phylogenetic analysis, the color representation blue to red indicates the increasing of conservation.