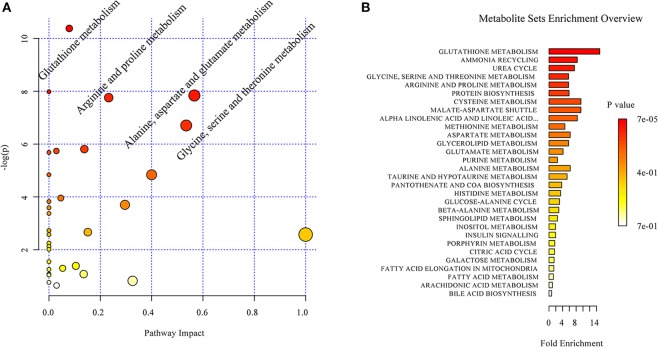
Figure 5.
Overview of the impact of acoustic trauma on brain metabolites. (A) The pathway impact of acoustic trauma on metabolites. The y axis shows the p-values and the x axis, the pathway impact values; the node color is based on its p-value and the node size reflects the pathway impact values. (B) The enrichment overview of the pathway-associated metabolite sets perturbed by acoustic trauma.

