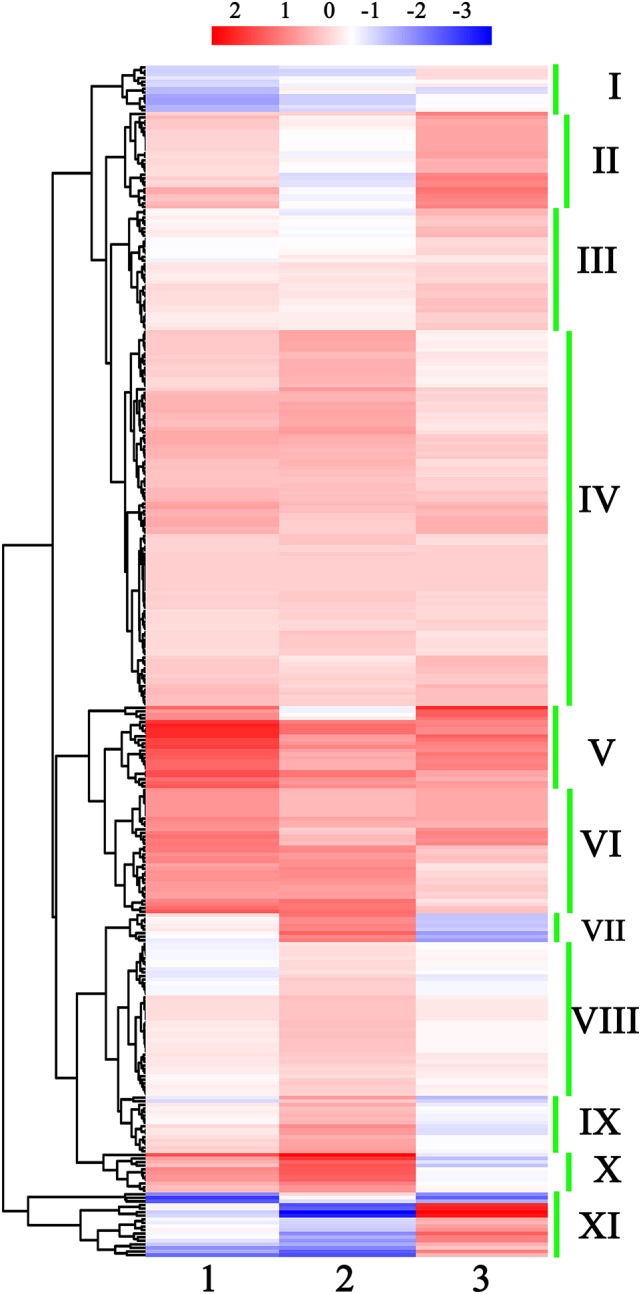
Figure 2.

Hierarchical clustering of all detected known miRNAs in early developmental stages of broccoli pollen. I to XI show the 11 miNRA groups clustered by their expression profiling. The color scale at the top illustrated the relative expression levels of each miRNA in two arbitrary developmental phases of broccoli pollen from high (red) to low (blue). 1, 2, and 3 at the bottom of three columns represented the relative expression levels of each miRNA shown by Log2 (uninucleate microspores/trinucleate Pollen grains), Log2 (binucleate pollen grains/trinucleate pollen grains) and Log2 (uninucleate microspores/binucleate pollens) ratio, respectively.
