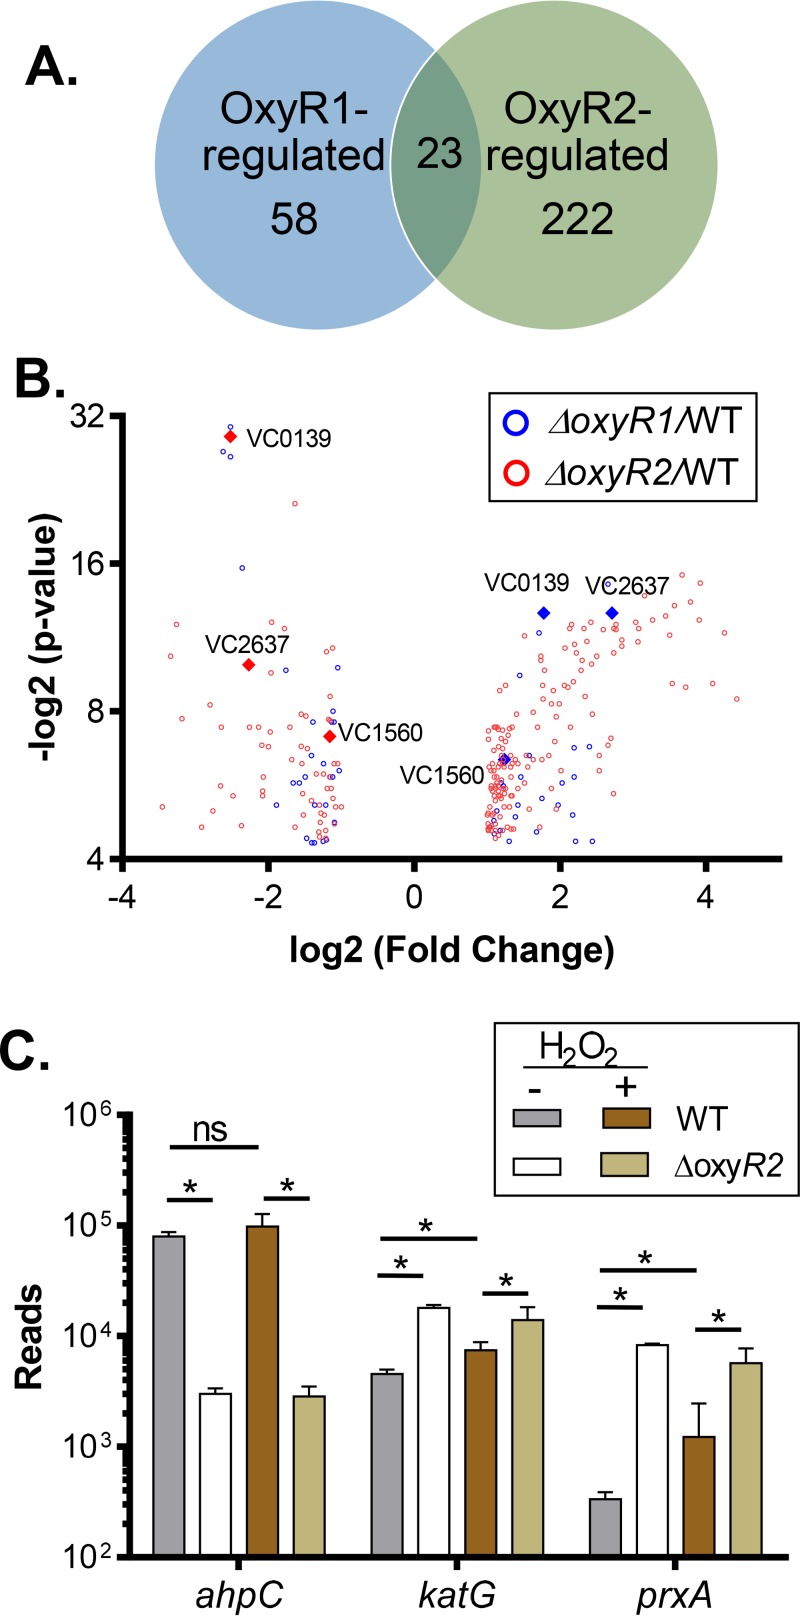
FIG 3.
Determination of OxyR1- and OxyR2-regulated genes by RNA sequencing. (A and B) Venn diagram (A) and volcano plot (B) of differentially expressed genes (fold change of >2, P value of <0.05) in ΔoxyR1 (blue) and ΔoxyR2 (red) strains in the presence of 50 μM H2O2. Diamonds represent oxidative stress-related genes common to the two data sets. (C) Normalized RNA-seq reads of selected genes in the wild-type and ΔoxyR2 strains in the presence and absence of 50 μM H2O2. Data shown represent the mean and standard deviation from two biological replicates. *, P value < 0.05; ns, not significant.

