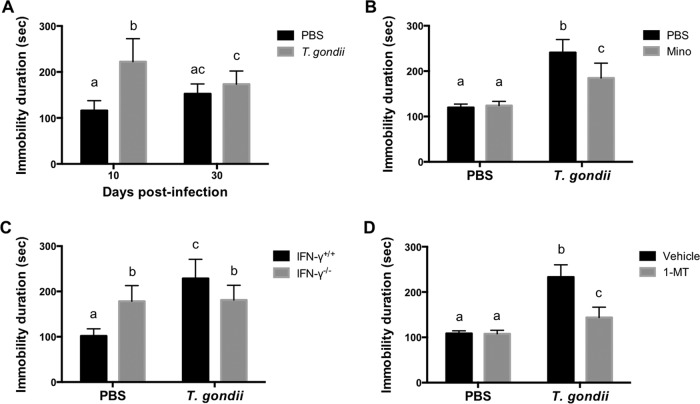
FIG 2.
Analysis of despair behavior by duration of immobility following T. gondii infection. The total time spent floating (immobility duration) in the FST was measured as a putative indicator of despair behavior. (A) Duration of immobility of wild-type BALB/c mice after injection with PBS or infection with T. gondii at 10 and 30 dpi. Data from two independent experiments are summarized and presented as means ± standard deviations [PBS, n = 4 plus 6; T. gondii, n = 4 plus 6; F(1, 36) = 4.24; P = 0.0002]. (B) Duration of immobility of wild-type BALB/c mice after injection with PBS or infection with T. gondii at 10 dpi under treatment with Mino (10 mg/kg i.p.) or injection with PBS from days 4 to 7 postinfection. Data are representative of data from two independent experiments with similar results and are presented as means ± standard deviations [n = 5 or 6 (one mouse died due to infection in the T. gondii-infected and PBS-injected group); F(1, 19) = 10.54; P = 0.0042]. (C) Duration of immobility of wild-type BALB/c mice (IFN-γ+/+) and IFN-γ−/− mice after injection with PBS or infection with T. gondii at 10 dpi. Data from three independent experiments are summarized and presented as means ± standard deviations [n = 3 plus 5 plus 5; F(1, 48) = 46.50; P < 0.0001]. (D) Duration of immobility of wild-type BALB/c mice after injection with PBS or infection with T. gondii at 10 dpi under treatment with 1-MT (50 mg/kg subcutaneously) or injection with the vehicle from days 4 to 7 postinfection. Data are representative of data from two independent experiments with similar results and are presented as means ± standard deviations [n = 5 or 6 (one mouse died due to infection in the T. gondii-infected and vehicle-injected group); F(1, 19) = 35.81; P < 0.0001]. Different letters above bars in the graphs indicate statistically significant differences among the groups by two-way ANOVA plus Tukey-Kramer post hoc analysis.

