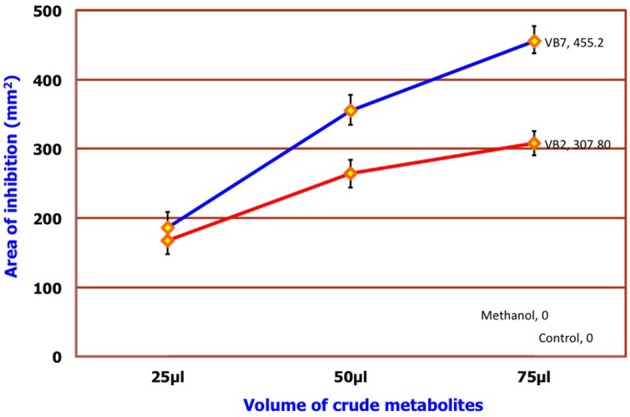
Figure 7.

Efficacy of crude metabolites of B. amyloliquefaciens. Data is presented as mm2 area. Error bars indicate standard deviation obtained from five replicates per treatment. Analysis of variance was performed through DMRT with IRRISTAT (version. 3/93, Biometrics unit, International Rice Research Institute). Blue line indicates the activity of B. amyloliquefaciens (VB7) and red line indicates the activity of B. amyloliquefaciens (VB2).
