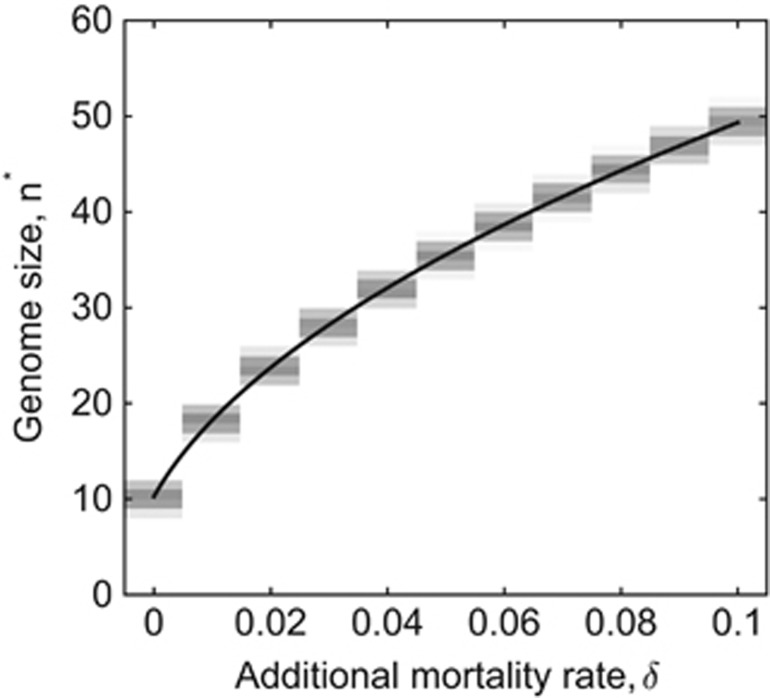
Figure 1.
The evolution of genome size as a function of the additional mortality rate, as predicted by the algebraic model (black curve, Equation 6) and tested through population-level simulations (grey bars). The population-level simulations relax key assumptions of the mathematical analysis, namely, limiting genome size to integer values and removing the separation of ecological and evolutionary timescales leading to a mutation-selection balance. The shading of the grey bars corresponds to the average frequency of each genome size over the final 1000 iterations of each simulation, with δ=0, 0.01, …, 0.1. Other parameters: b=1, c=0.000014, K=106 and δ0=0.005.

